Bottom line: In this video series you will learn how to use Pivot Tables to create meaningful reports and interactive charts and dashboards.
Skill level: Beginner
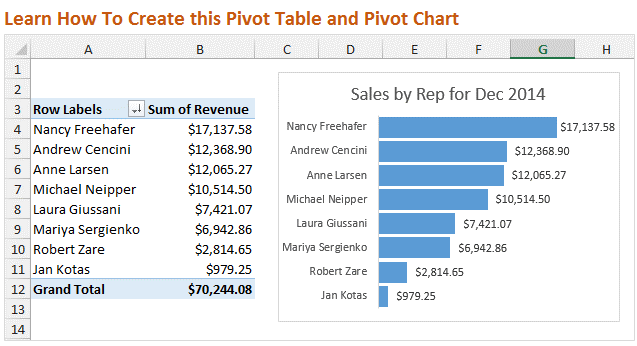
Video #1 – Introduction to Pivot Tables
In this first video we are going to learn how to setup your source data, then create a Pivot Table and Pivot Chart. I also show you how to reformat the chart to upgrade the look from the default settings.
Best viewed in Full Screen HD.
Note: If you are familiar with Pivot Tables then this video might be too basic for you. I would still love for you to watch the video, but don't want to waste your time. In the next two videos we will be putting together the dashboard. There is also a shorter video below where I give a Pivot Chart a makeover…
Downloads
Use this checklist to clean up your source data before creating a Pivot Table.
Use the following file to follow along with the video and create your own Pivot Table and Pivot Chart.
Pivot Tables are Amazing!
A few days ago I shared a story about how I got to teach my Dad how to use Pivot Tables. As you know he is really excited about Pivot Tables. They were easier to learn than he expected, and he is saving a ton of time when creating reports and summarizing his data.
So I want to share this same training with you!
Create Dashboards with Pivot Tables and Charts
In this video series we are going to follow my friend Andy on the journey to learn Pivot Tables.

Andy has been tasked by his boss to create some charts and a dashboard for an upcoming presentation. He really wants to impress his boss, but doesn't have time to learn complex formulas or macros. What he really needs it Pivot Tables and Pivot Charts.
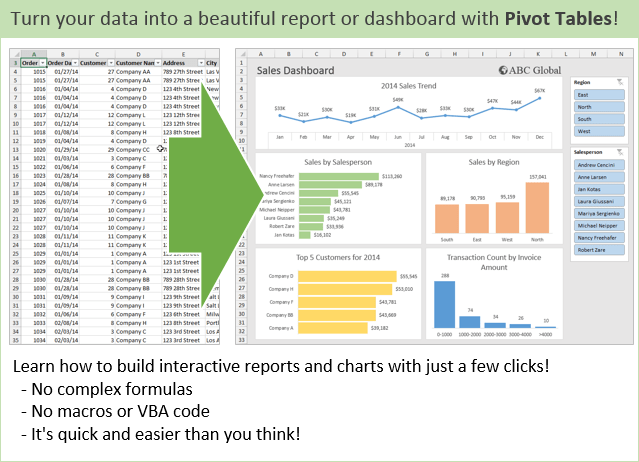
As you will see, Pivot Tables allow you to quickly summarize and analyze your data. I am going to show you how you can discover trends and learn a lot about your data with just a few clicks.
Bonus Video: Pivot Chart Makeover in Excel 2010
In the video above I explained how to reformat the Pivot Chart. In that video I was using Excel 2013. I recreated the video using Excel 2010 because the menus are a bit different and I want to make sure you could follow along if you are using Excel 2007 or 2010.
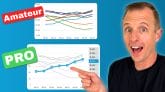
Why the Chart Makeover?
When presenting your data visually on a chart you want the reader to be able to easily understand the story you are trying to tell. To do this you want to get rid of all the extra elements that do not contribute to the story.
In this case we removed the axis labels, legend, vertical lines, and field buttons. This stuff can be referred to as “chart junk” because it tends to clutter the chart.
The default settings of the Pivot Charts typically contain a lot of chart junk. These extras elements can be distracting for the reader, and take away from your story.
The type of chart you create will determine what elements you want to display. There are entire books written on the art and science of data visualization, and it is definitely a good topic to study.
PivotPal is Here!
I show a few of PivotPal's features in the 11:28 mark in the video above.
PivotPal is now available!
Click here to learn more about PivotPal!
Thank You!
I want to say a big THANK YOU if you took the time to complete the pivot tables survey! The response was overwhelming and I am still going through all the results. I will share more about that with you in the coming weeks.
Additional Resources
- In part 2 of the series we learn how to use the different calculation types to investigate our source data.
- In part 3 of the series we create the dashboard and add slicers to make it interactive.
- Checkout my article on how to structure your source data for pivot tables.
- Here is an in-depth article on how pivot tables work.
Please leave a comment below with any questions. Thanks again!

Loved it. It is interesting to see the different ways one can modify pivot tables and how easy it truly is. Thanks.
Awesome! Thanks James! They really are an incredible tool, and I only scratched the very tip of the iceberg in this video. There is so much more that pivot tables can do.
Very Helpful, presentation is very understandable to the beginners like me!!!
Thanks Romeo!
Great video, Jon. Pivot Pal looks cool. Love the field number format feature. Setting number formats on a lot of fields really gets tedious fast.
Thanks Dave! Yes, I don’t know if I mentioned but you can select multiple fields and format them at the same time with PivotPal.
Nice job, Jon. Love the intro – nice way to set up the series.
Thanks Jeff! I should have named the boss Jeff W… 🙂
PivotPal looks awesome, Jon.
I can’t wait to get my hands on it. Will PivotPal work with Power Pivot PivotTables too? I can see the field list search being very handy.
Mynda
Thanks Mynda! I can’t wait to share it. PivotPal will eventually work with PowerPivot. It might not be available for the first release, but definitely in the near future.
I love your pivot pal. . . I would like to build a dashboard that automatically pulls data into the pivot table and refreshes the charts every hour. Is this doable?
Thanks Jay! Yes this is definitely possible with VBA macros. What is the source of your data? There are different ways to pull the data into your Excel file depending on the source of the data or the server that it is on. Once connected you will just need a few lines of code to run the macro at certain time intervals to refresh the data connection and pivot tables.
The Application.OnTime method will allow you to set specific time intervals to run the macro. The Workbook.RefreshAll method will basically refresh everything, data connections and pivot tables, in the workbook.
Please let me know if you have any questions. Thanks again!
its really great, it will help ma a lot.
Awesome! Thanks Praveen! 🙂
Is your datafile available to work with for the dashboard examples you created. I downloaded the pdf file but did not seem to get the raw data file.
Great training.
Thanks – j
I did see the data source together with the video training. Great examples for building a dash board. Thanks so much.
Judith
Thanks Judith! 🙂
i cant explain how much u helped me man ..thank you soooo much for making it easy to learn ..am your big fan JON..
Thanks Ahmed! I really appreciate that! I’m a big fan of anyone learning Excel. 🙂
John,
Thank you, this is excellent work.
How to Install PivotPal from ADD In
We have a client that requires we send pivot table worksheets to him so he can work in the pivot table. We do this be copying the worksheets to a new workbook and saving that with the weekly report data. If I use PivotPal to format, will the data look different since he does not have PivotPal? (and he works for the state, so he cannot get add-ins).
Thank you.
Hi Susan,
My apologies for not getting back to you sooner. The pivot tables you create with PivotPal will look the same on any computer. The computer does NOT have to have PivotPal installed.
PivotPal just automates some of the processes that you would normally do manually. It does not add anything extra to the Excel file.
Please let me know if you have any other questions. Thanks again and have a great day! 🙂
You’re an angel sent from above!
you are the ONLY person I listened to with when Pivot table is the topic. lolz!
Thank you for this and hope to learn more from you.
Keep it up.
=)
Thanks Jennifer! You are too kind. I’m really happy to hear you learned something new from the videos. Thanks again and have a great day! 🙂
Thank you very much, I found this really useful!
Pivot table is really helpful in analyzing data. The videos are awesome. The presentation is great, very clear. I learned a lot. I love to repeat viewing the videos to make myself familiar in this particular aspect of Excel. Thank you so much Jon. Hoping for more videos to come.
Thank you Margarita!
Thank you so very much! Your program helped me greatly and I learned a lot !!!
Thank you, Thank you!!!
Awesome! Happy to hear it. Thank you Na Suk! 🙂
This session was very helpful – it was explained in very clear terms and presented in an easy to follow format. I am a fan of your courses!
Very Nice, Pls keep on touch with us
Thank you for your teaching online
Hi Jon,
Thanks a lot for sharing such a great information. I have learned a lot with these three videos.
In addition to this i am planning to build a Pivot Table and Dashboard to get information on budgeting and maintenance cost analysis of all the asset.
It would be really very great if i get some suggestions to perform this.
Thanks,
Akshay
Thank you so much this is a fantastic presentation, very clear and so easy to follow it through. Very helpful,Great teacher.
Jon, Awesome video, just learned about it this morning and was able to create my own at a glance, many thanks, keep going and hello from Belgium
That’s great! Thanks Marc!
Hi Jon,
Thanks so much for the lesson on Pivot tables. I understand it now. You have a very simplistic way of teaching that I appreciate. I’ve watched two other videos from others, but their training was not as comprehensive and easy to understand as yours. You have increased my confidence with using Pivot tables.
Hi Gloria,
Thank you for the great feedback. I really appreciate it, and happy to hear you are learning pivot tables. They are one awesome tool! Have a great day! 🙂
Jon,
Tremendous YouTube series on Pivot Tables and Dashboards. I have been using your data source today and tomorrow will be uploading our company’s data source. Very valuable training. I recently paid $30 for an e-book on pivot tables and dashboards. I learned more from your two (watching the third tomorrow) videos than I learned from the e-book. Thank you for providing such a valuable service. I have passed on your website to many people already.
Hi Alan,
Wow, that is awesome! Thank you for the great feedback. I am really happy to hear you are learning pivot tables, and that the videos helped you. Pivot tables are a really great tool to learn, and I think you will find yourself using them a lot.
I really appreciate you sharing my site as well. Please let me know if you have any questions. Thanks again Alan!
Hi Jon:
I am trying to set a correct data source for a pivot table
by download a trial balance from QuickBooks Can this be done
if so please give me an example.
Thank
Leon
Hi Leon,
Great question! Can you send me an example of the data set. If it contains sensitive data you can change all the numbers to zero or something. I just want to see the data structure. [email protected]
I think this will be a good example for others to learn from as well.
Greetings Jon,
You are the best! This is my fist day to be watching Pivot-table videos. I always knew that Excel is an amazing program built with the most intelligent people/engineers in the world. Your videos compliment their ingenuity and art of making the impossible possible.
Thank you kindly.
Thank you Said! I really appreciate that. I agree that Excel is amazing! Have a good one! 🙂
Thank you so much Jon for an amazing free videos and tutorials. They are easy to understand and very engaging. I am very much excited to apply my new learnings and to learn more!
Awesome! Thanks Sheilane!
Hi Jon, thank you for a brilliant explanation, it made Excel jungle less scary for me lol
Just a quick question: How can I get Pivot Pal? It looks like a really useful tool thanks once again!
Hi Yuliya,
Click here to learn more about PivotPal. It is a paid add-in that you can purchase and download. Please let me know if you have any other questions. Thanks!
Jon,
Thanks for sharing your knowledge on Excel pivot tables. Really refreshing tutorials and easy to understand as well. Well done and please keep up the good work.
Thanks Bola! 🙂
Really useful and the best thing is the sheet is available to play around with.
Thats something that was missing in all other youtube tutorials. Im in a Operations Manager role and this helps me a lot to fine tune my skills.
Chandan aka Chandude
Awesome! Thanks Chandan! 🙂
Excellent videos Jon – extremely useful! I learned so much in half an hour today by watching your Pivot Tables / Charts videos – 1, 2 and 3. Greatly appreciate how simple the videos are yet very informative.
Thanks Louise! I’m so happy to hear you are learning about Pivot Tables, and that the videos helped. Have a great day! 🙂
Excellent videos 1,2,3. I learned a lot. Very simple.
Thanks Clara!
Very nice tutorial – gives explanations & examples, walks through the steps, & easy to understand. Thank you!
Thanks Pat! 🙂
It is amazing the way you explain. You make it very simple and useful. I became a fan of your tutorial videos. Thanks a lot.
Thank you Valentina! 🙂
Great Tutorial! Thank you very much for posting these wonderful videos. These tutorials helped me to refresh my Pivot tables skills to a new level.
Awesome! I’m happy to hear it. Thanks Rafeeq! 🙂
Thank you, I have a job interview tomorrow and this has been great to see how easy these are.
Thanks Rebecca! I hope your job interview goes well. 🙂
Great help but I wish you would have made it clear that I need to buy the pivot pal. I am learning at home on my own dime and cannot afford all the extras at this time.
Hi Cheryl,
You do NOT need to buy PivotPal to use pivot tables. PivotPal is just a tool that helps make it faster and easier to work with pivot tables. It is not required to create any of the reports, charts, or dashboards you see in this video series. I hope that makes sense. Thanks again and happy learning! 🙂
Thank you this really helped better than buying a book
Awesome! Thanks Viccy! 🙂
How do I only show the active data in a Table. If for example you only have 5 Columns and 10 rows in a Table I want to know the shortcut keys to delete un-used columns and rows in the worksheet. It’s a combination of Ctrl + Shift + down arrow but I can’t seem to do the delete correctly, Please help
Hi Acorn,
Great question! I have an article on keyboard shortcuts for working with rows and columns that should help. You can select the entire row with Shift+Space, then delete with Ctrl+-(minus). I hope that helps. Thanks!
Al Salamo Alikom
(It means peace on you in Arabic)
Thanks so much ,Really you know how to build up adds value for the user.
Thanks Sabek! Peace to you as well! 🙂
Hi Jon,
Thank You for sharing knowledge & love it much 🙂
May God Bless you always..Aameeen.
Thank you Tina! 🙂
I have always clumsily dabbled with pivot tables with a lot of frustration. Your video made it look so simple and interesting. Thank you indeed, Jon.
Thank you Constant! 🙂
Thank you my teacher who send me this excel Campus lesson (pi vote)
Thank you Thythav! 🙂
thank you.. this is great.
Thanks Gina! 🙂
Hi,
My Excel spreadsheet is not counting the blank cells when I do the pivot table. What do I do?
Really very practical and easy to get even for the beginner.
Thank you Gayane!
Very Helpful, thanks ! Kiranya Tuhan memberkahi anda !!
Thank you Handoyo! 🙂
Hi Jon,
Can you help me on this:
My data will be like this:
Date Hour Minute Orders
07/07/2013 7 0 24
08/08/2013 8 1 59
07/07/2013 7 9 09
———————–
———————————-etc
Like that I have 100 of records..for each hour in a day..0,1,2,3….22, 23 like that each min..0,1,2,3…………58,59 per order.
I could not able to make the calculated fields to perform following actions..
Overall
Max of Order in a day/Sum of Orders in day.
Max of order in an Hour/sum of orders in an hour
Max of order in a min /sum of orders in a min
When I am trying to make it, the formal is not working and data is not showing up.
Do you have any clue?
Thanks in advance.
Hi Choudary,
Unfortunately, calculate fields won’t be able to perform those types of calculations. You will need PowerPivot and DAX measures for that. I have some links on my resources page to help with learning PowerPivot. I hope that helps.
Very helpful thank you.
Hi Jon. Thank you for the video series on Pivot tables. I have wondered for a while what this excel feature was about – thanks to you, I’ve added to my skills set. Interestingly, it’s not as difficult to learn as I had imagined.
Thanks Gabriel! I’m so happy to hear you are learning pivot tables. You are right. For some reasons pivot tables get a bad wrap for being complex and scary, but they really aren’t too bad. 🙂
Thanks Jon:
This video was such a great help. very clear and concise.
Can’t wait for video 2.
Thank you Stacey! 🙂