The following video tutorial is an in-depth look at Excel Tables.
I show you how to create a Table and then explain 10 awesome features that will save you lots of time when working with your data. The Tables feature is available in Excel 2007, 2010, 2013, and 2011 for Mac. This video is a step-by-step guide and the file I work with in the video can be downloaded below.
Video Tutorial
Download File
What is an Excel Table?
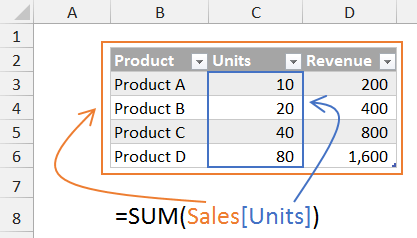
Tables are a feature in Excel that let you convert a range of data into an organized list called a table. They help automate many repititive tasks such as formatting, sorting, filtering, and summarizing your data. Tables bring a new and intuitive way to write formulas using structured references. They also integrate with Excel's most powerful tools including charts, pivot tables, remove duplicates, PowerPivot, and more.
10 Awesome Reasons to Use Excel Tables
There are a lot of great benefits to using tables. Here are the 10 that I explain in the video.
- Formatting | 1:55
- Table Names | 2:44
- Sorting & Filtering | 3:15
- Auto Expansion & Navigating | 4:35
- Total Row | 6:34
- Remove Duplicates | 7:18
- Create Unique List | 7:53
- Pivot Table Integration | 8:33
- Chart Integration | 10:24
- Table Formulas | 11:26
The video also shows some incredible new features for Excel 2013 including Recommended Pivot Tables and Recommened Charts.
Additional Resources & Videos
Here are some additional videos and articles that helped me learn tables. Please let me know if you have any others to add to the list.
Videos
Excel Tables Feature (Excel as a Database) | Excel Is Fun (18:29)
Create an Excel Table With a Specific Style Applied | Contextures (2:14)
Microsoft Excel 2013 Timeline Video | Excel and Access (8:50)
Chandoo Explains Structured Table Reference | Mr. Excel and Chandoo (5:52)
Absolute References in Structured Table Formulas | Excel Campus (7:17)
Articles
Creating an Excel Table | Contextures
Save Time With Excel 2007 Tables | MyOnlineTrainingHub
Learn Excel Data Tables | Chandoo
Why you should use structured references in tables | Zack Barresse
Absolute Formula References in Structured Tables | Excel Campus
Working with Microsoft Excel tables in VBA | Zack Barresse
Overview of Excel tables | Microsoft
Books
eBook Version – Excel Tables Book
Paperback version – Excel Tables Book
How Do You Use Tables?
Do you use Tables? Why or why not? Please leave a comment below. And don't forget to subscribe to my free email newsletter below to get more articles like this and learn Excel.


I learned so much from your videos. It has saved me so much time on my Excel schedules. Thank you.
Thanks Chelo! I am really glad the videos help you. Please let me know if you have any questions.
Hey Jon,
I know that this post is already somehow aged however it landed in my inbox just recently. I really love it as I use CTRL+T all the time but always struggle when someone asks me what’s the advantage of using tables in your spreadsheet files. Now I have a link I can refer people to 🙂
Hi Phil,
That’s exactly why I made this post/video. There are so many great features of tables, and most users have not even heard of them yet.
Thanks!
tnx jon
Hi Jon,
Thanks for a really informative video! Excellent for a beginner like myself. I have one question regarding removing duplicates. I don’t have the same options as you do when trying to remove the duplicates. Excel tells me no duplicates are found, even though I believe I’ve followed your instructions exactly. This of course makes it difficult for me to remove them. I’m using Excel 2011 for Mac, could that be the reason? Is there something I’m missing? It seems like a really great feature and surely would be handy in the future. Thanks! //Alexandra
Hi Alexandra,
Thank you, I’m glad you enjoyed the video. I’m not sure why you are having issues with the remove duplicates, but I would be happy to take a look at your file to see if I can help. You can email your file to me at [email protected]. I will try it out in the Mac version and see what’s up.
Thanks again!
[…] to—which is ok too. If you want to learn more about Tables (besides this website), check out this blog post from Jon Acampora. And of course, there’s a cool book on the subject (chapter 4 is dedicated […]
hi jon
just wanted to thank you for this good video i discovered your website yesterday i am addicted to it
thanks
Hi Adel,
Thank you for the kind words! I’m happy to hear you are enjoying it. Have a good one! 🙂
[…] maintaining significant simplicity. If you’re not familiar with Tables, a good starting point is this blog post (with video) by Excel MVP Jon […]
Hi Jon,
I a newbie at using excel and I keep searching tutorial in Youtube to help be more efficient in using excel application. I gotta tell you, I didn’t realize the value of the table function until I watch this video of yours. Great work!
Thanks JC! Tables really are one of the best tools in Excel. Not many people use them yet, so spread the word. 🙂
Awesome and easy to understand videos
Thanks Rajesh!
Thanks for enlightening me about tables. I had no idea about the versatility. Saved me days!
Aweseme! Thanks Tom! I’m happy to hear that Tables are saving you some time. They are a really great feature.
Dear sir,
Thanku very much for sharing this valuable information.
This video is really amazing.
Regards,
Rajan
Awesome video Jon. I have learned some tips and tricks today. I was still putting the ‘freeze top row’ on because yay I didn’t realise that the column headings would do that if it’s a long table. Time saving and once again thanks for another handy video. Cheers
I have been expanding my skills with tables and this video has been very helpful for periodically re-watching. I am also using pivot tables at work and confused a bit on how to expand the pivot table when copying in new data from one spreadsheet and have the data update in the pivot table.
HI, I have just discovered “Tables” and I hope you can help me 🙂 I have a table that contains Columns with a date header from 01/01/16 to 31/12/16 and I have 2 Columns called Live Start Date and Live End Date. I would like the cells (below the date columns) in each row that corresponds to the Start Date and End Date and all cells in between to be updated automatically with the letter “L”
Any help will be greatly appreciated.
Hi Jeannette,
Great question! You can use a IF function to create a formula for that. The main issue is that the header cells store the values as text. So we first need to convert the header cell to a date value with the DATEVALUE function. We also need to a special trick to make the start and end date cell references absolute with the structured table references. The formula gets a little long, but is definitely possible.
I created a quick sample file that you can download and checkout.
Here are links to some other articles that will help.
How to write an IF Statement Formula in Excel
How to create absolute references with Table Formulas
I hope that helps. Let me know if you have any questions.
Thank you so much your sample is exactly what I needed. I had got as far as realizing the Date Headers were considered as Text Fields but then gave up and came up with a workaround which was not ideal as it left only half my Table as a table and the rest just data. I still can’t believe I haven’t found Tables before now and if I hadn’t stumbled across your article I would still be none the wiser 🙂
I am happy to hear it helped. Thanks for letting me know Jeanette! And don’t worry, you are not alone with Tables. Most Excel users don’t use them or know how beneficial they can be. Spread the word! 🙂
Hello, I enjoyed your 3 part video on creating a dashboard in excel. I understand slicers and how they can be used to select various pieces of data with one or more of the items selected. But is there a simple way to create a slicer that allows you to input a range of values, either with a text input or a slider you can drag(similar to a timeline slicer)? For example if you wanted to select a range of values that are >0, or a range of 150-1000, instead of manually cntrl+selecting that many boxes in your slicer?
Thanks,
Forrest
Hi Forrest,
One approach is to add an additional column (field) to your source data that contains the groupings. You can create the results of this column with a formula. Checkout my article on grouping times for some different ways to group the numbers or text. The VLOOKUP might be the best approach if your groups are uneven.
Once you have a new column with the grouping, you can just create a slicer based on that field. I hope that helps. Thanks!
I have been using tables for some time now but I have been manually entering new weekly data from two csv files. I want to build a new set of tables, different layout, using the csv files. I have a working vba program which gathers all the ~400 files data into ‘standard’ arrays.
It is possible to block copy table data into a structured reference array.
Questions,
Is it possible to start with such an array before creating the table?
What does the syntax look like to build the array?
HI Jon,
When should I be using tables vs named ranges in Excel? I think tables are a great feature, but I think for large amounts of data(500k rows), it can be hard to work with in excel.I think it would be beneficial to have a blog post regarding working with large amounts of data in excel.
Thank you for the suggestion Peter. I will put it on the to-do list. 🙂
Brilliant video simple informative and practical. Well done I am using all the learning to make life easier and help my work colleagues with data analysis
Thank you Salim! 🙂
Jon:
The videos are really helpful and you do a nice job explaining everything with clear and concise direction.
However I keep running into this problem when I try to replicate the vlookup example you demonstrate.
When I click on the cell C3 in your example I get the following
=vlookup(Table4[[#This Row],[Rep Name]:[revenue]]
instead of the ([@[RepId]) you get in your example.
What am I doing wrong?
Thanks.
Fred
Hi Fred,
The [#This Row] notation is used in Excel 2007. This changed starting in Excel 2010 to use the @ symbol instead. So you aren’t doing anything wrong. It’s just the version of Excel you are using. Sorry, I forgot to mention that in the video. Thanks!
I have an Excel 2010 workbook with 2 tables. One of the tables contains a vlookup formula. If I try to change the formula, instead of recalculating Excel just displays the formula in the cell that I tried to update. As a point of reference, I’m trying to change the formula in the first row directly below the header. I thought this would then update the full column. Automatic calculation is turned on. Even if I try to manually force the calculation, it still will not update the column. Any advice?
Hi Richard,
The only thing I can think of is that you have an apostrophe in front of the equal sign. That will cause the formula text to be displayed in the cell and the formula will not calculate. I hope that helps.
Hello Jon,
Firstly, thank you very much for sharing above items.
Secondly, I love advance excel, I would like to learn new and surprised things in advance excel.
please share new tips and tricks in advance excel.
Thanks and Regards.
Aslam Velji
Wished I had looked at this sooner. Great stuff question do you have anything on tables using VBA code?
Thanks Paul! I do cover Tables (ListObjects) extensively in my VBA Pro Course. They are a great tool to use with VBA because they create a dynamic range within a sheet that is easy to work with and reference in VBA. I will try to create some additional training videos on Tables and VBA in the future. Thanks!
Thanks a lot.
Hey Jon,
I am working as a financial controller in private sector. as you know as every body else on the field that the business owners’ are highly demandable in a special kind of reports reflecting the financial & operational performance measurement for the accounting period just ended. The reports which is usually asked for financial analysis prepared on excel sheet attached with it dashboard summarizing whole information in one simple sheet.
My main queries how to convert financial information on the excel sheet prepared to A raw data which helps me out later on preparing creation a pivot table which finally helps me prepare a dashboard to the to management.
As you know, financial analysis report prepared in a way that representing the on the column header the year or years ( multiple periods )and on the left side the criteria and core is the financial information figures for a balance sheet and income statement.
hopefully, that I made myself clear enough, to help me preparing the dashboard as how it suppose to be done in a very professional way to be presented later on to top management.
I will be so grateful if you send A case study file with editing ability to study on my personal email stated.
Thanks, for your valuable support and help.
Raed Azroun
Hi Raed,
Financial statements can be created with pivot tables. Getting the layout right can be tricky sometimes, depending on how you want to group and categorize the P&L and BS.
I do have a free video series on pivot tables and dashboards that you might enjoy. You can also create financial statements that pull in data from pivot tables using the GETPIVOTDATA function. This allows for more customization in your layout. I don’t have an article on that yet, but will add it to the list.
I hope that helps.
What a informative video? Didn’t know there are so many features in simple table form. And small tips shared to avoid simple mistakes one makes while dealing with the data are very helpful.
Hai Jon Thanks for providing such a useful videos with relevant practice materials.. really it helps a lot… and your voice so good for listening.. Thank you soo much for your hard work to extend our excel knowledge.
The 10 Excel Pro Tips Workbook was excellent. I like the way the 10th tip ended. Lol. I finally found that cell I kept thinking about from Tip 6. Excellent presentation.
Jon I love your presentations. simple and easy to follow. Much appreciated. Keep up the good work.
Thank you for making it clear and easy to follow. I also like using you pivot checklist.
Best,
Mohamed
Hi Jon,Very interesting of your cooperation and excel materials.I am very impressed
Good morning Jon,
Great info on tables. Great job on the presentation. I think I might start to like them now.
You are the bomb!
Hi Jon,
Kindly tell us…
How can hide the formula with continue working formula,I meant can not show to other but formulas should work accordingly..
Thanks for another great video, I’ve seen your videos on pivot tables and dashboards. So I thought it might be worth while to take a step back and learn more about “simple” tables. It is.
One question about create unique list. I figured that out, copy/pasted the unique values, now how do I un-deduplicate to return to the original table? kills the copied unique values too …
There must be a simpler way than displaying the clipboard, repeating the copy/paste, using then repeating the paste from the clipboard …
Well done. I like to believe that I am a power user. I’m always pleased to find out that I’m missing some really powerful tools to do what I’m already doing manually. I was doing 50% of what I learned in this video. The other 50% is going to add great productivity.
Hi Jon, thanks so much..2 questions real quick:
What if I am doing a vlookup on a table where the column I’d like to look up is not the first column in the table? How will the structured reference know which column to do the lookup?
And, the @ sign tells the formula to work with the data in the same row as the formula, what if I need to lock the reference (absolute, not relative), how do I do that?
Thanks so much for all your great videos, absolutely love them!
Excellent tutorial. Thanks.
Nice blog right here! Also your web site so much up fast! What web host are you the use of? Can I get your associate link to your host? I want my site loaded up as fast as yours lol
Thanks for this very easy to understand tutorial. I am now a convert as I have been embarrassed by not having my pivot tables update with new rows.
Thank you Jon, love these tutorials and find them very easy to follow.
interesting ! Thanks for information !
Thanks for your good website and information !
I love tables.
If you every update this video, there are 2 points I’d like to see added to it.
For data entry, you tab from column to column. When you reach the end of the row inside of the table the next tab inserts a blank row and places the cursor in the first column of the table.
As well as filters, I really would like to have seen mention of slicers. Especially in connection to charts.
this is great i need it
thanks
great
thanks for your good data
Thank you for your website and all easy to understand tutorials.
great
good luck
thanks for your good data
good luck
Excellent jon thanks
Great teaching, thanks, God Bless
Hi Jon – Great video and explanation.
excellent video and great teaching!