Excel Bad Habit #7: Using Formulas When Pivot Tables Are a Better Option
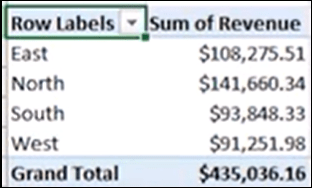
Let's say your boss gives you a big table of data and asks you to create a summary report of the revenue per region.
Watch on YouTube & Subscribe to our Channel

You might be tempted to create a list of unique values, write a complex SUMIF formula, and then format the results into a legible report.
Instead, you should use pivot tables! They're fast and easy.
How do you create a pivot table?
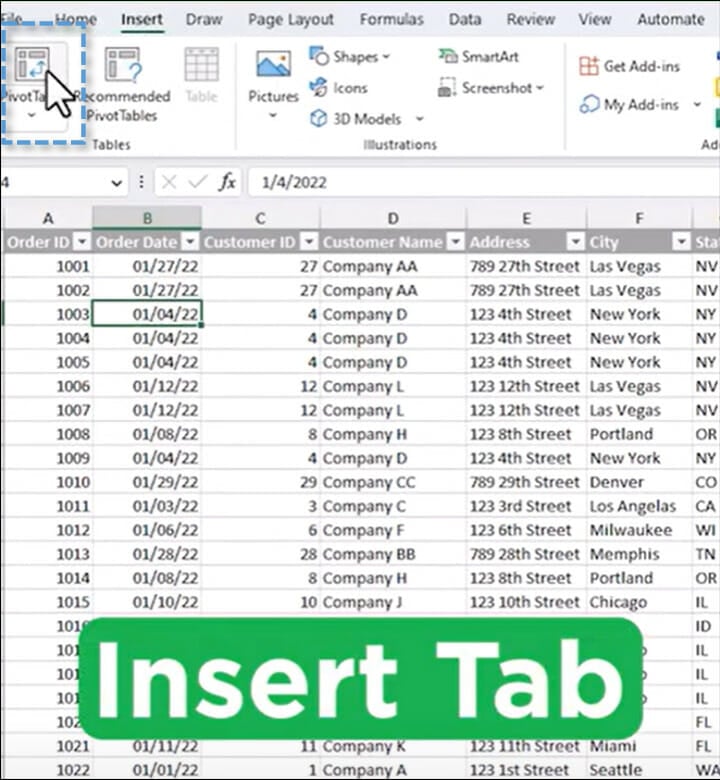
Start by selecting any cell in the data range and go to the Insert tab. Click on the Pivot Table button.
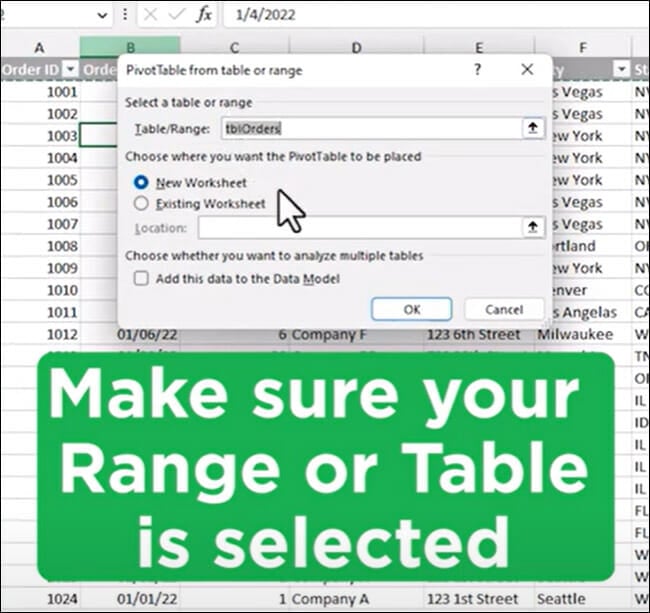
Double-check that the range is correct. Then press OK.
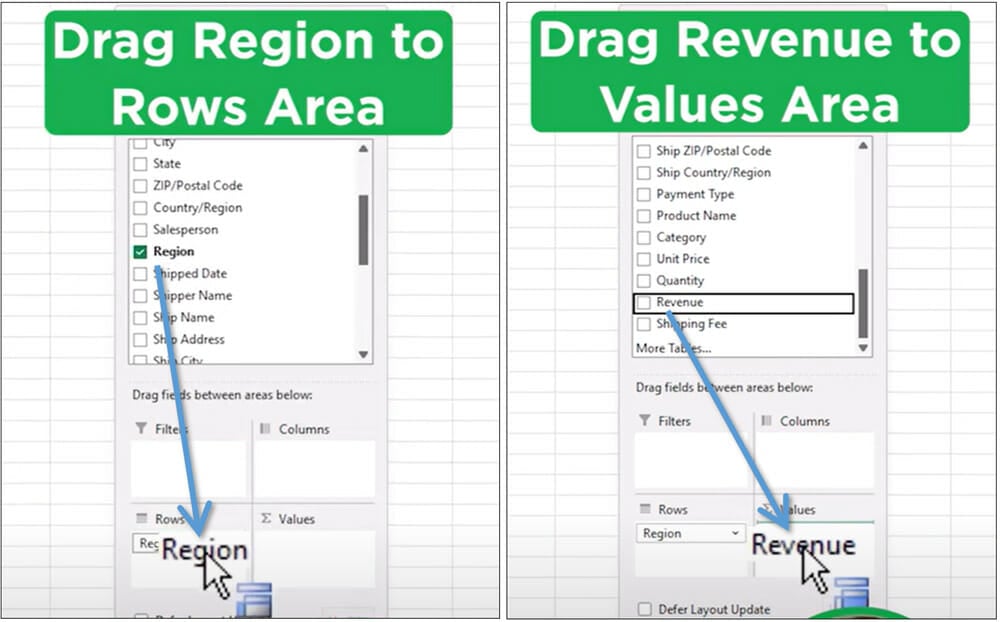
Drag the Region field into the Rows area and the Revenue field into the Values area.
That's it! With just a few mouse clicks, you've created the entire report requested by your boss.
Pivot tables don't require you to write any formulas, and they do all of the formatting work for you. You can also use them to create interactive reports, charts, and dashboards.
For a more in-depth look at pivot tables, check out this tutorial:
Be sure to leave questions or feedback in the comments section below. I hope this quick example of pivot tables helps you create summary reports that your boss will appreciate!


Thanks. I am stuck on how to create an aimline between two points in one series of a two series chart. There has to be an easier way than what I am doing.
Fantastic demonstration of the benefits of using a pivot table, I agree in that it can save so much time in writing formulas when it does it for you!
Thank you,
Sheena.
Hey there and thanks for all the great videos. I’m quite familiar with Pivot tables but just can’t seem to figure out a way to arrange my data so a pivot table will work as intended. I’m reporting on 10 sites monthly, that include about 12 different data variables (sales, budget, gas, availability of machines, efficiency of machines, etc.) I have my data laid out with the month down left column (A) but each site would need a unique identifier for its associated columns (ie NY sales, NY budget, Ny gas, CT sales, CT Budget, CT gas). I think it may be too complex to use a pivot table on and I don’t want to break the data out into separate tables for each region. Any ideas or suggestions would be appreciated. Thanks!