Bottom Line: Master these essential Excel features to become a power user and streamline your workflows with automation, formulas, and AI-driven tools.
Skill Level: Intermediate to Advanced
Watch the Tutorial
Watch on YouTube & Subscribe to our Channel
Download the Example File
Follow along with the same workbook used in this post.
Excel Power User Checklist
If you want to level up your Excel skills, this checklist is for you. These 15 essential Excel features will help you analyze data faster, automate tedious tasks, and build powerful reports with ease.
Whether you’re managing financial models, databases, or dashboards, these tools will transform the way you work in Excel. Let’s dive in!
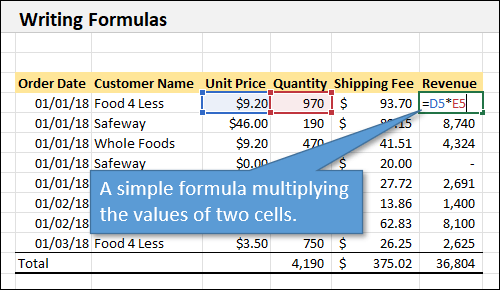
1. Simple Formulas
Every Excel user needs to understand basic formulas. Simple arithmetic operations like addition, subtraction, multiplication, and division form the foundation of Excel calculations. You can enter a formula as simple as =A1+B1 or use built-in functions like SUM to speed up your work.
Mastering simple formulas is essential before diving into more advanced techniques.
2. Functions
Functions are formula templates that Excel has prewritten. Understanding functions is the foundation of Excel proficiency. Key functions every power user should know include:
- SUM, AVERAGE, COUNT – Essential functions for basic calculations.
- MAX & MIN – Identify the highest and lowest values in a dataset.
- COUNTIF & SUMIF – Apply conditions to count or sum specific values.
These basics are just the tip of a very large iceberg when it comes to functions. Here are 50 top functions that you can print and use as a checklist as you increase your proficiency and master each function.
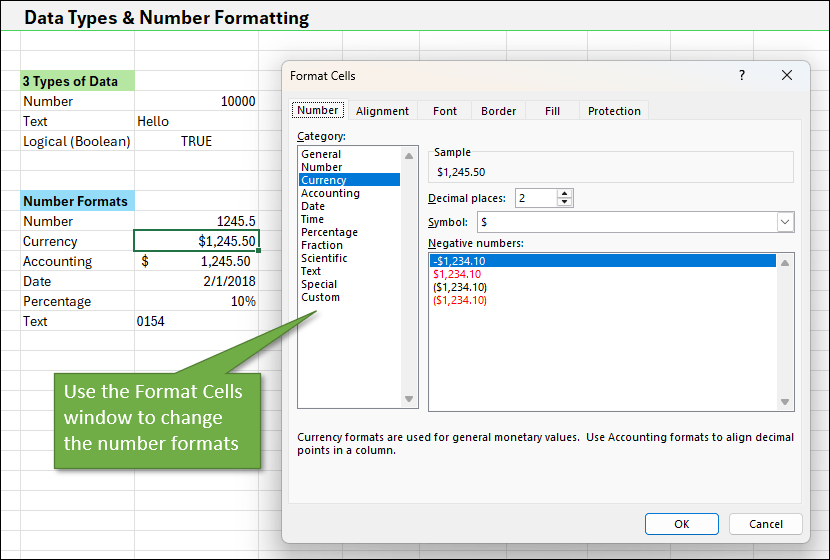
3. Data Types & Number Formatting
Excel supports various data types, including numbers, text, and Boolean (TRUE/FALSE) values. Applying the right number formats ensures accuracy and readability. Use Ctrl + 1 to open the Format Cells window and customize your number formats.
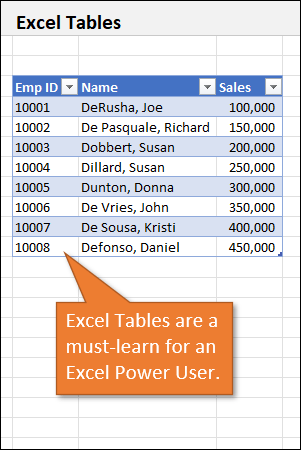
4. Excel Tables
Excel Tables make working with data easier by enabling automatic filtering, sorting, and structured referencing. They expand dynamically when new data is added, ensuring formulas update automatically.
Additionally, the Table Design tab provides quick formatting options, a Total Row for automatic calculations, and the ability to insert Slicers for easier filtering. While tables are great for organizing data, they may not be ideal for extremely large datasets or certain VBA applications.
To learn more about Excel Tables, start here: Excel Tables Tutorial Video
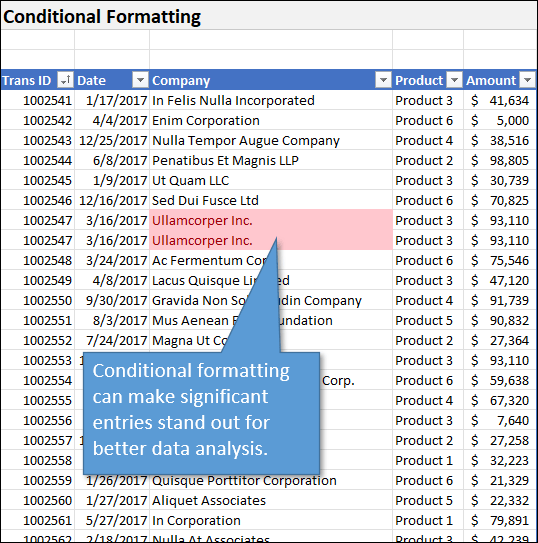
5. Conditional Formatting for Quick Insights
Conditional Formatting helps you visually analyze data by highlighting key patterns. Whether identifying duplicates, outliers, or trends, this tool applies formatting rules based on cell values. You can highlight top-performing sales, overdue payments, or cells that meet specific conditions—all without manually scanning the data.
6. Lookup Formulas
Modern Excel users should be familiar with XLOOKUP, which replaces older functions like VLOOKUP and HLOOKUP with greater flexibility. With XLOOKUP, you can search for a value in a column and return a matching result from another column—without worrying about data being sorted.
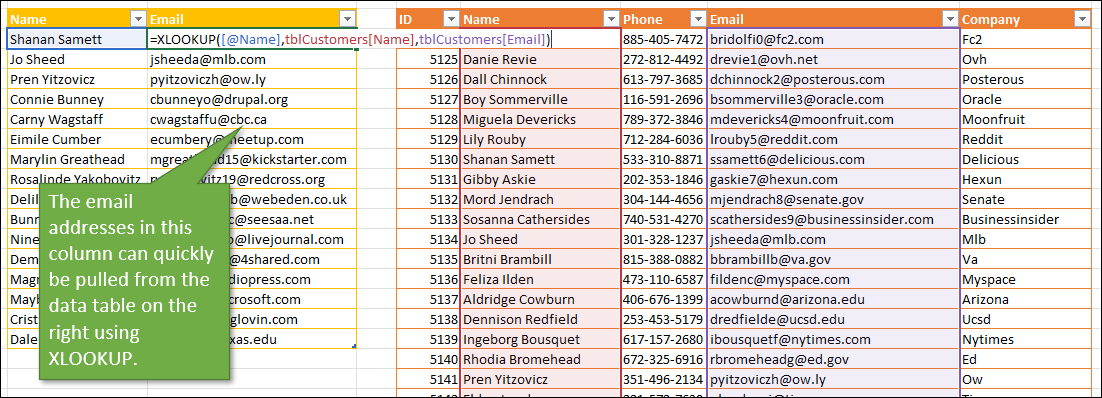
If you need to retrieve multiple matching results, the FILTER function is a game-changer. It dynamically extracts and displays all matching records, making it perfect for customer data, order history, and financial transactions.
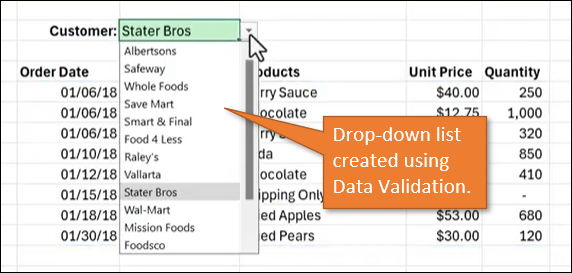
7. Data Validation
Ensuring accurate data entry is essential in Excel. Data Validation allows you to restrict input values, ensuring consistency and reducing errors. One of the most common uses is creating drop-down lists based on existing data. This feature helps prevent typos and ensures uniformity in datasets.
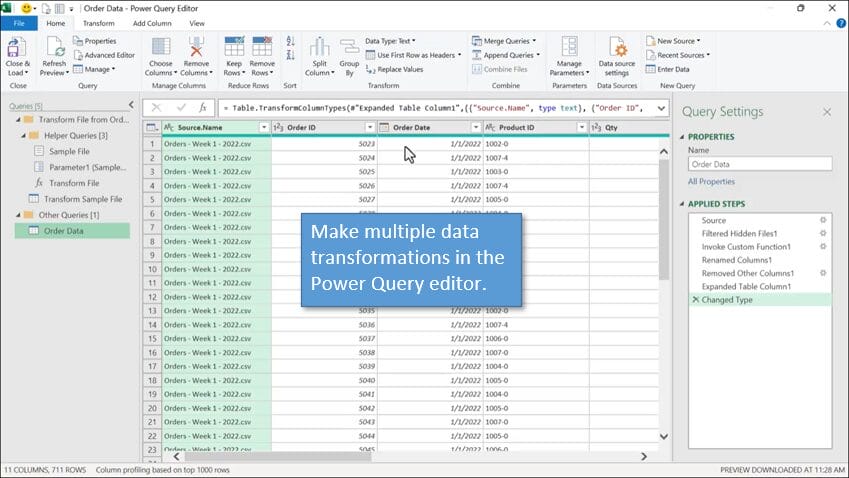
8. Automating Data Cleanup with Power Query
Power Query is Excel’s built-in data automation tool that allows you to clean, transform, and merge data from multiple sources with just a few clicks. Instead of manually editing CSV exports each week, Power Query enables you to refresh data automatically and apply predefined transformation steps. This is a massive time-saver for anyone dealing with repetitive data cleanup tasks.
For more on Power Query, check out this tutorial: Power Query Overview: An Introduction to Excel’s Most Powerful Data Tool
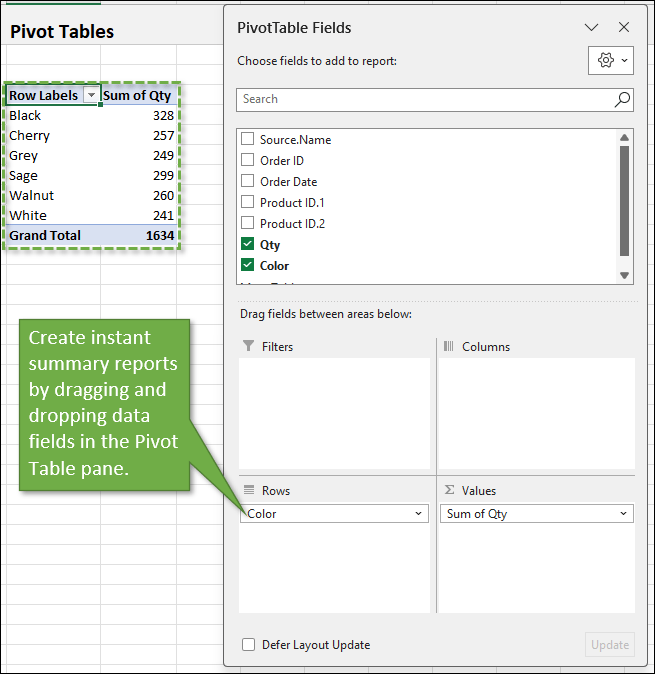
9. Pivot Tables
Pivot Tables are one of the most powerful and flexible tools in Excel for summarizing large datasets. With drag-and-drop functionality, you can quickly group, filter, and analyze data to generate instant reports. Whether tracking sales trends, inventory levels, or financial performance, Pivot Tables allow you to gain insights without writing complex formulas.
10. Pivot Charts & Slicers for Interactive Reports
Pivot Charts take Pivot Tables to the next level by visualizing summarized data in interactive charts. With Slicers, you can filter data dynamically, making it easier to explore key trends.
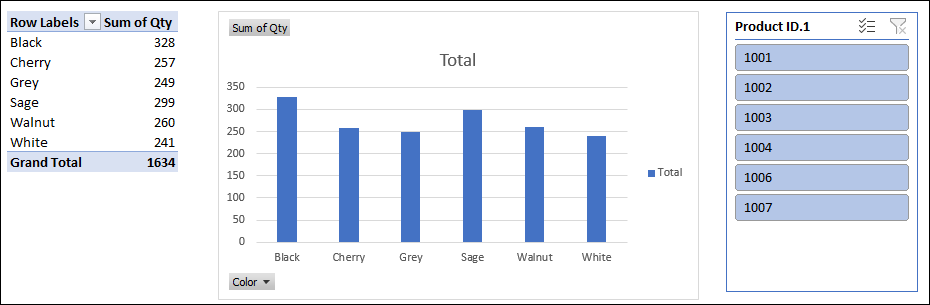
Combining multiple Pivot Tables, charts, and slicers can create interactive dashboards, offering a streamlined way to present data insights.
11. Power Pivot for Advanced Data Modeling
For advanced reporting, Power Pivot allows users to work with large datasets across multiple tables using data relationships. It eliminates the need for manual lookups by creating structured data models.
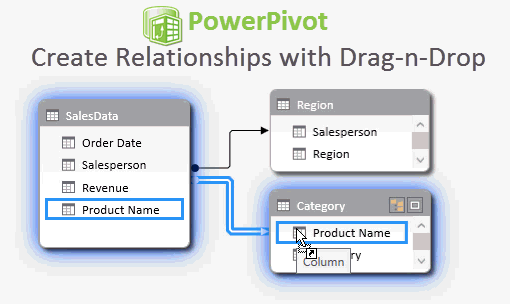
Power Pivot also introduces DAX (Data Analysis Expressions), a powerful formula language used to calculate KPIs, variances, and complex aggregations.
Learn more about how to use Power Pivot here: [LINK?]
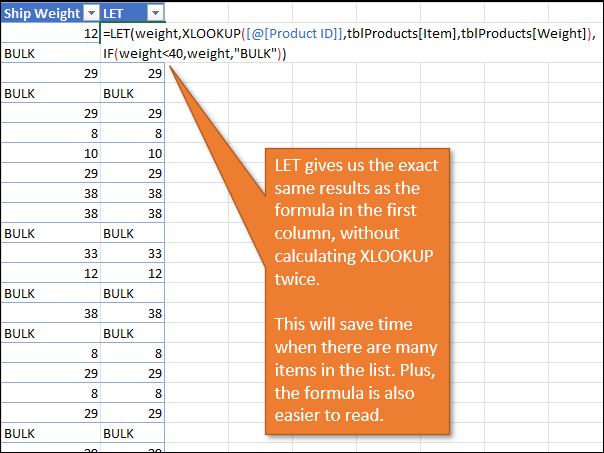
12. LET Function for Efficient Formulas
The LET function improves formula efficiency by storing values as variables within a formula. Instead of repeating the same calculation multiple times, LET enables you to define intermediate results and reference them throughout the formula. This approach enhances readability, performance, and ease of troubleshooting, especially in large workbooks.
Walk through an example of the LET function here: Intro to Excel’s LET Function: Simplicity + Efficiency
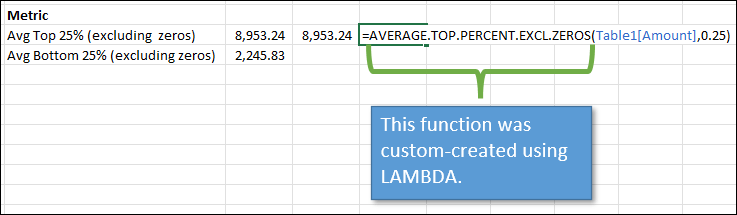
13. LAMBDA
LAMBDA enables users to create custom Excel functions without VBA. Instead of copying a complex formula repeatedly, you can define it once and reuse it across your workbook. This feature allows users to build reusable, dynamic calculations, making formulas easier to maintain and share.
14. VBA + Office Scripts
Automation in Excel is made possible through VBA (Visual Basic for Applications) and Office Scripts.
VBA allows users to write macros to automate repetitive tasks, such as generating reports, cleaning data, or formatting sheets.
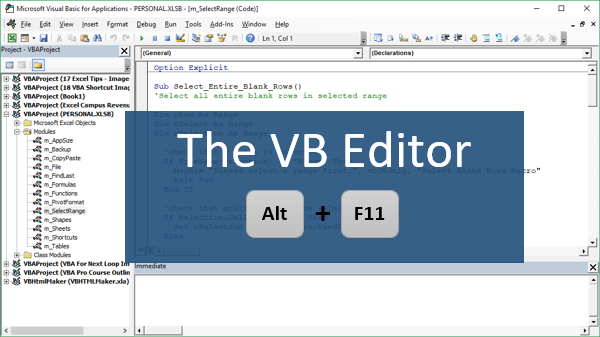
Office Scripts, a newer alternative for Excel on the web, provides a cloud-based solution for automating workflows without traditional coding.
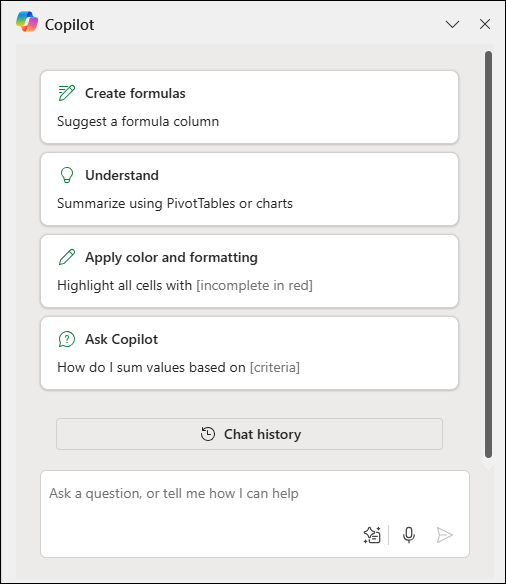
15. AI & Copilot in Excel
Excel’s AI-powered features are evolving rapidly, with Copilot leading the way. AI tools in Excel can generate formulas, analyze data, and even debug Python scripts.
While AI can significantly speed up your workflow, it’s important to double-check the results for accuracy.
Outside of Excel, AI-powered assistants like ChatGPT, Gemini, and Claude can help with Excel troubleshooting, VBA coding, and complex formula writing.
Conclusion
Mastering these 15 skills will elevate your Excel expertise and allow you to analyze data, automate workflows, and create dynamic reports with confidence. If you'd like to take the next step in become a Power User in Excel, try my free Modern Excel Blueprint Webinar.
Which features do you rely on most? Leave a comment below and share your favorite Excel tips!


thank you
Can we do a Vulcan mind probe? You have so much Excel knowledge and I have so little time!!! Thanks for loving Excel as much as I do…