Bottom line: Learn how this awesome feature of Excel and Power BI called Power Query will help you automate the process of importing, transforming, and cleansing your data to save a TON of time with your job.
Skill level: Beginner
Video Tutorial
Download the Sample Files
The CSV files I use in the video are available for download below. You will need to extract the files out of the zip file.
Introduction to Power Query
In this tutorial I provide an introductory explanation of Power Query. You will learn why this is my new favorite Excel tool for working with data, and how it can help automate processes and save you time!
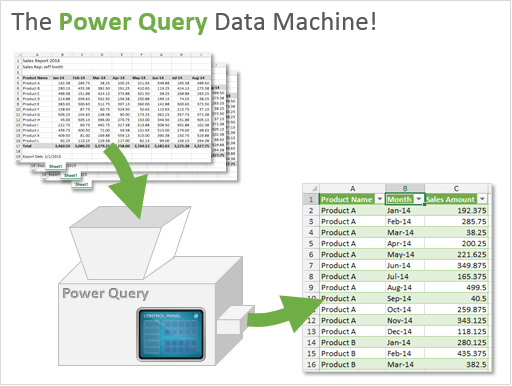
The Power Query Data Machine
I was watching a TV show on how things are made, and they were explaining how a depositor machine worked in a pastry factory.

The basics of a depositor machine are:
- You add ingredients to it.
- Change some settings.
- And it magically creates pastries (cookies, donuts, biscuits) that are ready for baking.
Once the dials are set, the process can be repeated over-and-over again to make perfect pastries every time. Getting hungry…? 🙂
Power Query works in a very similar way!
- You add your data sources (Excel tables, CSV files, database tables, webpages, etc.)
- Press buttons in the Power Query Editor window to transform your data.
- Output that data to your worksheet or data model (PowerPivot) that is ready for pivot tables or reporting.
Power Query is like a machine because once you have your query setup, the process can be repeated with the click of a button (refresh) every time your data changes.
If you have used macros to transform your data, you can think of this as a much easier alternative to VBA that does NOT require coding.
Common Data Tasks Made Easy
Do you work with data that has been exported from a system of record? This could be a general ledger, accounting, ERP, CRM, Salesforce.com, or any reporting system that contains data.
If so, you probably spend a lot of time transforming or re-shaping your data to create additional reports, pivot tables, or charts.
These data transformations could include tasks like:
- Remove columns, rows, blanks
- Convert data types – text, numbers, dates
- Split or merge columns
- Sort & filter columns
- Add calculated columns
- Aggregate or summarize data
- Find & replace text
- Unpivot data to use for pivot tables
Do any of these tasks sound familiar? If so, then they probably also sound boring, repetitive, and time consuming. 🙂 Believe me, I’ve spent the better part of my career doing these tasks and trying to figure out faster ways to get them done.
Fortunately, Power Query has buttons that automate all these tasks!
Overview of the Power Query Ribbon
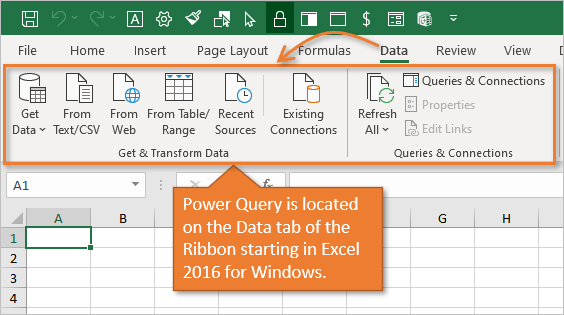
Starting in Excel 2016 for Windows, Power Query has been fully integrated into Excel. It is now on the Data tab of the Ribbon in the Get & Transform group.
In Excel 2010 and 2013 for Windows, Power Query is a free add-in. Once installed, the Power Query tab will be visible in the Excel Ribbon.

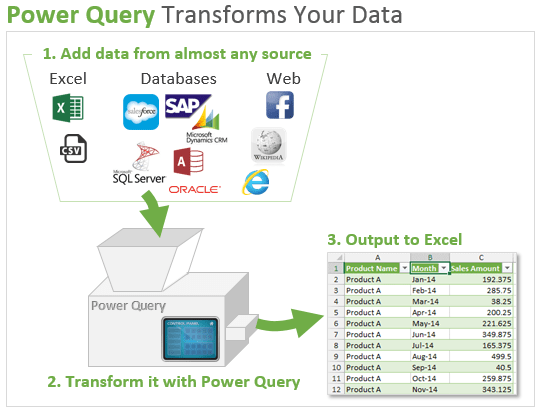
You use the buttons in the Data or Power Query tab to get your source data. Again, your data could be stored in Excel files, csv files, Access, SQL server database, SharePoint, Salesforce.com, Dynamics CRM, Facebook, Wikipedia, websites, and more.
Once you have specified where your data is coming from, you then use the Power Query Editor window to make transformations to the data.
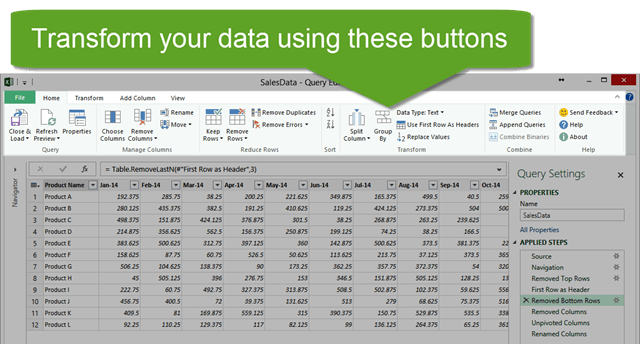
The buttons in the Power Query Editor Window allow you to transform your data.

Think about some of those tasks you do repeatedly as you browse the buttons in the image above. Each time you press a button your actions (steps) are recorded, and you can quickly re-apply the steps when you receive new data by refreshing the query.
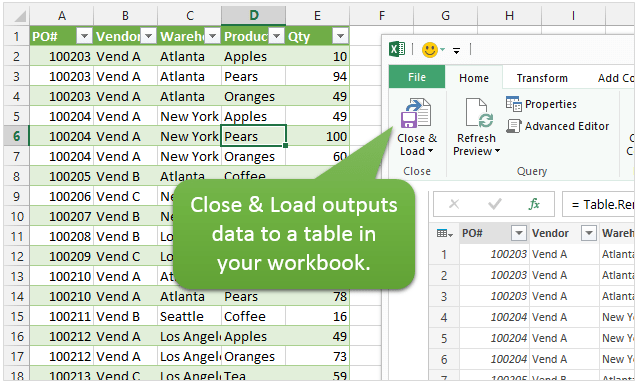
After completing your steps, you can output the data to a Table in your Excel workbook by clicking the Close & Load button.
You can also modify existing queries and refresh your output tables with the changes or updated data.
Data Transformation Examples
Here are a few examples of what Power Query can do with your data.
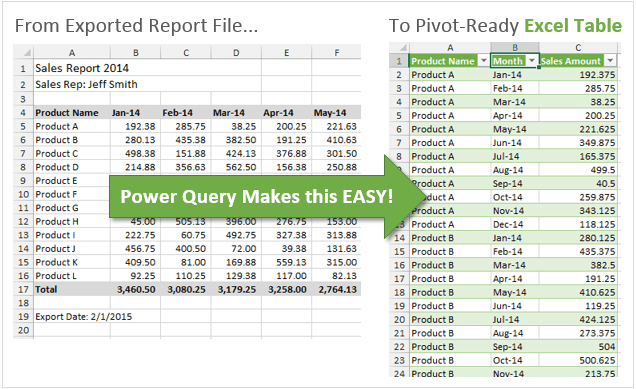
Unpivot Data for Pivot Tables
My favorite feature of Power Query is it’s ability to Unpivot data. This is a technique used to get your data ready for the source of a pivot table. This is also referred to as normalizing your data to get it in a tabular format.
The data might start out looking something like the following.
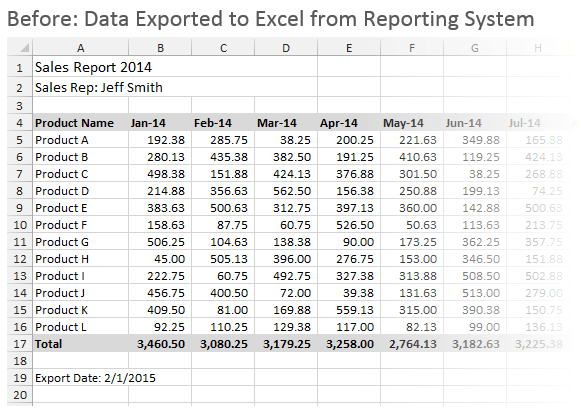
And you want the end result to look like this.
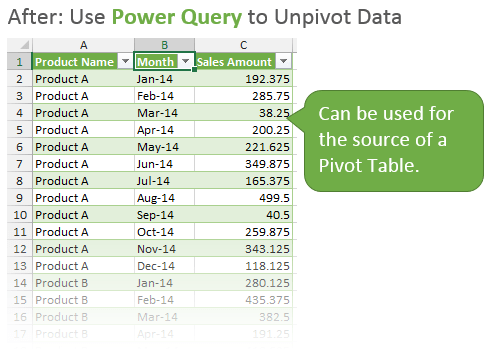
Power Query can do this with the click of a few buttons, and prepare your data for use in a pivot table.
Here is an article and video on exactly How to Unpivot Your Data with Power Query.
Checkout my article on how to structure your source data for a pivot table if you are unfamiliar with why your data needs to look like this for a pivot table.
Append (Combine) Tables with Power Query
The Append feature of Power Query allows you to combine multiple tables (stack them vertically) to create one large table. It can do this with multiple tables in one file, or it can pull in data from a bunch of different files/sources.
Let’s say you have a folder that contains CSV or Excel files with report data for each month. Throw all those files in the Power Query machine, and it will spit out one nice table that you can then use to create pivot tables and charts.
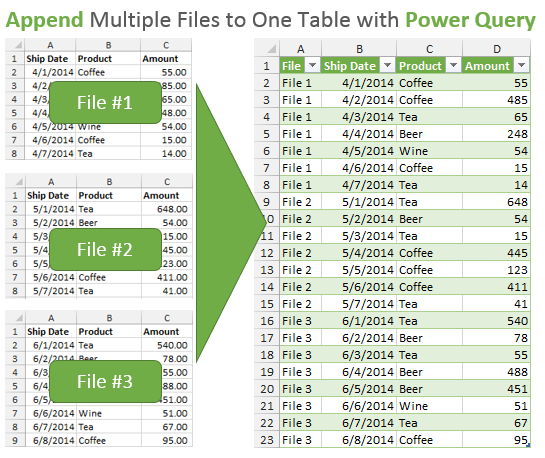
If the data in those reports also needs to be transformed (remove rows, split columns, unpivot, etc.), then Power Query can handle that in the same process.
Once it is setup, all you have to do is hit the refresh button every month when a new file is added to the folder and the rows will be added to your output table.
How awesome is that! 🙂
Merge Tables – A VLOOKUP Alternative
Power Query has the ability to merge or join tables. This can be used as an alternative to VLOOKUP or INDEX/MATCH formulas.
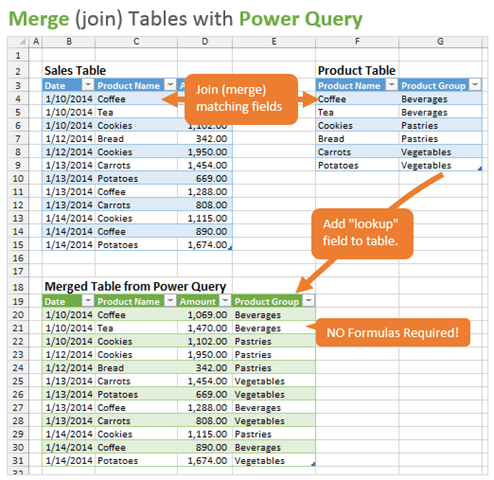
Let’s say you have this data table of sales records, and you are using a VLOOKUP to bring in information about the product based on the name of the product sold. Your product group information is located in another table on a different sheet or workbook.
Using VLOOKUP formulas is great, but it can often mean adding thousands of formulas to your workbook. Which increases the file size and calculation time.
Power Query makes it very fast and easy to merge two tables together with just a few clicks. It basically uses SQL joins, so you can even do more advanced merges like inner, outer, left, right, full, and anti joins.
Create Custom Functions
Power Query was designed so that you do NOT have to know how to code to use it. It is very easy to use because you can just click buttons and apply filters like you normally would in Excel.
However, Power Query can be programmed to create custom functions. This gives you seemingly unlimited potential to transform your data in just about any way possible.
It is based on the M language, and most of the functions are very similar to writing a formula in Excel. This also makes it more user friendly and easier to learn the code.
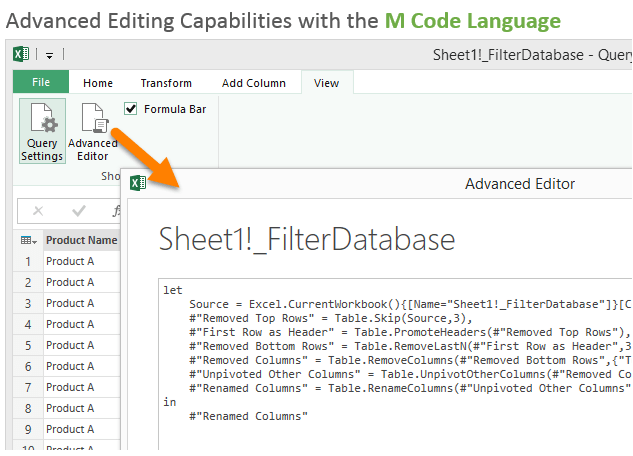
This new language and set of functions means there is a lot to learn, but I consider that the fun and challenging part. Plus, employers of the future will definitely be looking for employees with Power Query skills.
Power Query Records Your Steps & Automates Processes
Power Query not only makes all these tasks easier, but it also records your steps so you do NOT have to do them over-and-over again. It will save you a lot of time if you are preparing the same data every day, week, or month.
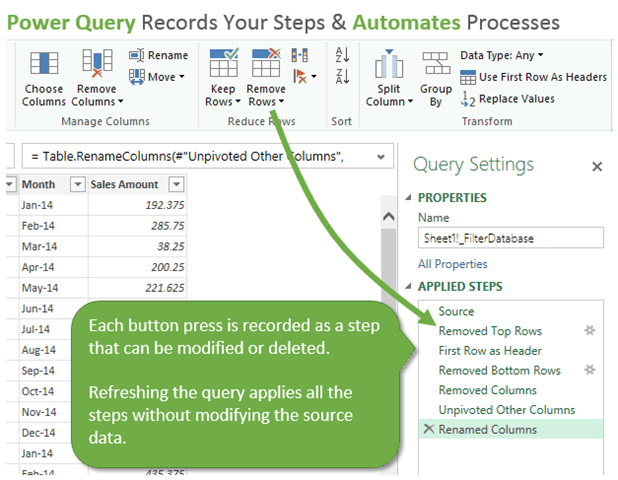
It also does a pretty good job of handling errors. If the structure of your source data changes, Power Query will tell you what step it broke at and allow you to fix it. This makes maintenance easy and you don’t have to completely redo your process when something changes.
You can use Power Query to get your data ready for use in pivot tables, charts, and dashboard reports. This is a critical step in the process of summarizing and analyzing data.
The Power Query Machine & Power BI
Well, it can’t exactly make cookies, but Power Query is a pretty awesome tool! It will save you a ton of time when transforming your data.
Power Query is just one piece of the suite of Power BI (Business Intelligence) products from Microsoft.
If we go back to the analogy of baking cookies in a factory, you can think of Power Query as the first step in the assembly line. Once the cookies are formed, we then need to bake them (Pivot Tables, PowerPivot) and then package them for presentation (Power View, Power Map, Charts, Dashboards, etc.)
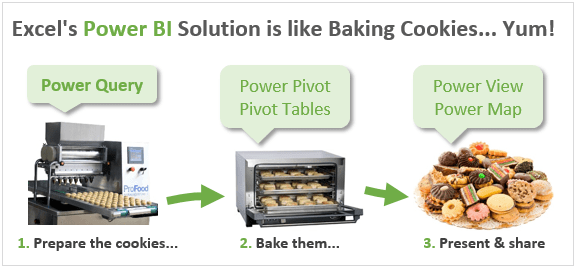
You can think of Excel as the factory building that houses all these tools. The exciting part is that there is a very bright future for Excel! All these advances in technology will help us make sense of our data in new ways, save us time, and impress our bosses. 🙂
How Do I Get Power Query?
The other nice part is that Power Query is now built into Excel starting with Excel 2016 for Windows. If you are on Excel 2010 or 2013 then Power Query is a free add-in.
I have a dedicated page that will help you determine if you have the right version of Excel to get Power Query. It also provides complete installation instructions and the download link.

Complete Guide to Installing Power Query
To give you an idea of the importance of this tool, Power Query was fully integrated into Excel in Excel 2016 for Windows, and is on the Data tab of the Ribbon.
It is also known as Get & Transform, although the term Power Query is most common.
Additional Resources
This article has provided an overview of the basics of Power Query that should help you understand some of the major features. Power Query has a ton of features and there is definitely a lot to learn.
I will be sharing more how-to articles and videos in the coming weeks. Here are a few resources that will help you get started.
How to Unpivot Your Data with Power Query + Video Tutorial
Free Training Webinar on the Power Tools
Right now I'm running a free training webinar on all of the Power Tools in Excel. This includes Power Query, Power Pivot, Power BI, pivot tables, macros & VBA, and more.
It's called The Modern Excel Blueprint. During the webinar I explain what these tools are and how they can fit into your workflow.

You will also learn how to become the Excel Hero of your organization, that go-to gal or guy that everyone relies on for Excel help and fun projects.
The webinar is running at multiple days and times. Please click the link below to get registered and save your seat.
Click Here to Register for the Free Webinar
What Do You Think?
Are you using Power Query yet? If so, please leave a comment below letting me know how you use it.
If not, do you think it would be useful for you? Are you doing any of the tasks I mentioned manually right now?
I will be creating more how-to articles and videos on Power Query in the future, so I’m interested to know what you want to learn.
Thank you! 🙂


What a freakin awesome intro, Jon. I’m sticking a link to this in the book…
Thanks Jeff! Now I really can’t wait for the book. 😉
Dear Jon Acampora,
First of all thanks for valuable material and information. I am going to an offline application on MS excel using Power Query and Power View. the purpose of application is that we have many customers in different cities and we have many branches in many cities so we calculate the latitude and longitude of address of both customer and branch offices, now i want to achieve that using power view map it displays the result when i click on customer order and location wise it tells the distance from all where houses and from that we classify that which is branch is near to Customer address so that we can say that branch for delivery. if it is possible in excell then please reply and help me .
thanks for your anticipation.
Hi Zahid,
That is a very interesting question. You can do this with custom VBA functions. Here is an article that explains how to do it using the Google Maps API and a VBA function (macro).
http://www.microsofttrends.com/2014/10/22/integrating-excel-and-google-maps-to-geo-code-your-addresses/
You can also search Google for “geocode distances in Excel” and see lots of other solutions. I don’t have much experience with this so I can’t recommend one solution over the other.
Great and comprehensive introduction to Power Query.
Thanks for this.
Glad you enjoyed it. Power Query is awesome!
Jon
Absolutely superb introduction to the latest “hidden gem ” within Excel.
Keep up the good work.
You made my day Roger! Thanks and great to hear from you. 🙂
“Hidden gem” is the perfect term for Power Query.
Love the analogy, Jon.
I too am loving Power Query at the moment.
It’s just a shame you’ve got to have a specific version of Excel to get it. I think everyone with Excel should be able to have it.
Mynda
Thanks Mynda! I completely agree. I wish Power Query was available for everyone. I think it’s worth the upgrade if you have a need to automate any data related processes. But it would still be nice if everyone could have it. 🙂
Beautiful overview, Jon. Well done!
Looking forward to taking Power Query for a spin soon…
Yes it is very good but I cannot work out how to save and reuse the queries created.
I get a csv file every day which I manipulate the way I want it.
I have gone through the power query steps, go want I want, but cannot see where I reuse the query.
Hi Stephen,
Great question! The query you setup points directly to the CSV file location. You will see this in the Source step of the query. To reuse the query you will need to replace the CSV file with the new one everyday.
Let’s say you saved the CSV file at the following location. C:\Documents\MyData.csv
When you get the file tomorrow, you will need to save your file to the same location, replacing the existing file.
Then go to Power Query and refresh the query. Just hit the refresh button in the query pain, or right-click the output table and press Refresh. This will re-run the query on the new CSV file and output the data in your table.
If you want to add new data to an existing Table, then you can use the From Folder feature to get data in Power Query. This will bring in all the CSV files from one folder. Then you can append the tables together to make one big table.
I hope that helps. Let me know if you still have questions. Thanks!
[…] of demonstrating how you can really fine tune and clean up the data you import through Power Query. Interesting Examples that Might Apply to Baseball DataThis is a fairly lengthy post, but look specifically for the sections labelled “Append […]
First time using Power Query and you made it so much easier! My data is in different tabs and I used the “Append” button to combine all tables into one single table. During the process, I am selecting “Only Create Connection”. I noticed there is a check box for “Add this Data to the Data Model” Wondering if you can clarify what that would do?
Thanks Diana! Power Query is a pretty awesome tool. Great question about the Data Model.
Loading the query to the Data Model will allow you to use the data in pivot tables and Power Pivot pivot tables without having to load the data into a spreadsheet in the workbook. If you have a large data set then this can reduce the file size. The Data Model is only available in Excel 2013 and beyond, so if you have users on 2010 still they will not be limited on what they can do with your workbook.
Please let me know if you have any other questions.
Thanks!
Perfect tolls Quary, View, Map
Hello Jon,
thanks for your efforts here. Some advice if you have the time please?
I have 2 tables where column A in both have numbers 90% common to each table although the order may be different, the other 10% are either unique or blank in each table. So, each table has rows that may (?) key to the other row. All other columns are totally different in content & number.
I’d like to add each matching row of table 2 to the end of the matching row of table 1 by column A number but am stumped by the Merge function. Massaging the tables to be of the same column and row number seems to have helped importing but the resulting table has blank cells for columns B-Z from the second table.
Any hints on how to proceed Jon?
Regards,
Chris.
Hi Chris,
Sounds like an interesting challenge. If possible, could you send me your file or a sample file? I want to make sure I fully understand your question. [email protected]
Thanks!
Hi Jon, Was going through your blog, I am hoping you can help me with my query. I am working on a project where I need to match two data sets from different sources. Now, the 1st challenge is standardizing the data. So, can standardizing be done with Power Query. Ex: like removal of special characters from the column, changing some words to standard format(Limited to LTD) and number of cleansing process to be carried out. So, can all these steps can be done through power query. Please let me know your inputs on this.
Rgds,
Anindya
Hi Anindya,
Great questions! Yes, it sounds like your data cleansing process can all be done in Power Query.
Power Query has a Replace Values feature that will allow you to find and replace words. You will also be able to remove special characters with the same feature. The nice part about Power Query is that once you have this query setup, you can just refresh it and all the same steps will be applied to your data. It’s similar to a macro, but you don’t have to do any coding.
I hope that helps. Thanks and have a good one!
Hi Jon thanks for your input. I tried doing it, but I have to do it for each values I change. Now, this is near impossible, I have around 3000 values to be replaced and all are different. Ex: in a column if limited is there I have to change it to ltd, if company is there then Co, if holdings is there then HLDG. Likewise there are like 3000 replace value needs to done.
So, each time I have to click replace value button to replace the particular step. Can this be done at one shot? Can you please help me with this problem?
Yes, I see how that could take along time with that many different replacement values. You could do it with either formulas or VBA. You will probably want to create a table that contains two columns with the search value and replace values. You could then use a lookup formulas and the SUBSTITUTE function to find and replace the values. Alternatively you could use VBA to loop through the table and find and replace values in your data set. I hope that helps.
Hi there – have started working with Power Query recently and find it very powerful. However I wondered whether you know if there is a way you can run a query created from Power Query on a PC that doesn’t have power query installed?
Eg I have a shared spreadsheet in which I have created a query using Power Query, and I’d like other people to be able to refresh the query without having Power Query installed.
Any ideas?
Thanks!
Hi Oliver,
Great question! If the users are on Excel 2010 or 2013 then they will need to install Power Query on their computer. If they are on Excel 2016 then PQ is built-in and they will not need to install anything. Therefore, they will be able to do the refresh with no problem in Excel 2016.
Let me know if you have any questions. Thanks!
Thanks! We’re all on 2013, but not too much of an issue (only talking a few people.
Hi Jon,
New to PowerQuery..
Actually i have daily one daily process In that process I have to prepare file properly
Currently I am using Libreoffice Macro for that
Is it possible that I click on one file then Input File open and then It will make proper file and then export as csv
I have 50 different files which I have to make it proper daily
Input file could be CSV, Excel, Textfile
I am able to process it by libreoffice macro Is it possible in Powerquery
Thnks
Hi Yogiraj,
Power Query will not be able to output to a CSV file. It outputs to an Excel Table in the Excel file. I hope that helps.
Hi Jon,
This is good page & tremendous work. I have a question:
In power query: I have applied some (say 5) steps to 1st workbook file.
I load 2nd file, and i want to apply those 5 steps to this file also.
Though both files are similar, i don’t want to update my 1st file from 2nd file.
I want to keep the source files (say 1st/2nd/3rd files…) separately, load each of these files separately, and use applied steps (from query editor) to these files.
My source files are big (which are generated weekly).
So, if I go on updating those weekly data on a single file (my 1st file), then my PC will not be able to handle that 1 big ever-increasing file.
So, instead of keeping 1 source file, I want to keep my source files separately, but use the same queries steps to all (and go on updating the output file).
Any suggestions on how can I do this?
Hi Abiral,
You can create a query that appends or combines data from multiple workbooks to make one data table. Here is an article by my friend Miguel that explains how to combine multiple workbooks with Power Query. I hope that helps. Thanks again!
Hi Jon,
Is it possible to compare two files with particular Column data and then delete from one file
let me explain more
I have two different file one is EXCEl or PowerQuery file and One is CSV file
both has one column common
I want to compare both with that common column and delete whole rows from CSV file which has already data in EXCEL power query File
I hope you would get my Qeury
Hi Yogi,
Yes, it is possible. You will probably need to use a macro if you want to automate the process.
You could use Power Query to do the comparison, then load a table with the results, then save as a new CSV file.
If you want to delete data from the original CSV file then you will need VBA to automate that process.
You could also open the CSV file in Excel, add a column with a lookup formula like COUNTIF to check if the value exists, filter and delete rows that don’t match, delete the column with the lookup formula, and save the CSV. Here is an article on how to use COUNTIF instead of VLOOKUP.
I hope that helps. Thanks!
Can dashboards created with Power Query and Power Pivot be shared with users that do not have these add-ins installed on their computers without losing the connection to the analysis server, or do they have to install the add-ins in order to get the full functionality of the shared dashboard?
Hi Vicky,
Great question. If the user is just going to view the dashboards then they won’t need the add-ins. However, if the pivot table is built with PowerPivot and there are slicers, then they will need the add-in to interact with the pivot tables.
For Power Query, the user will not need the add-in if they are just interacting with a regular pivot table. They will only need the add-in if they are going to refresh the query (data connection to the server). I hope that helps. Let me know if you have any other questions.
Another option is PowerBi.com. This tool basically combines PowerPivot and PowerQuery, and allows the users to view and interact with your dashboards online at PowerBi.com. It is completely free to use. You can even Excel files to it and objects from the Excel worksheet like pivot tables and charts. I did an overview video on PowerBi.com a while back, but it has been improved a lot since then. You can also pull data from the Analysis Server.
I hope that helps.
Thanks!
Hi Jon,
Please I need your help. I would like one book to learn hot to use Power Query. For my job will be so important. Maybe you know a special author (I would like to buy a book about this subject)
Thanks a lot for your reply to my email
Warmest regrads,
Rodney Gonzalez
Hi Rodney,
I can recommend two books. Both “M for Data Monkey” and “Power Query for PowerBI and Excel” are great books. You can read my reviews about these books on my resources page. I hope that helps.
Thanks and have a great day!
Hi,
I have series of workbooks I import data from via PowerQuery. The source files only have the Date field completed every 4 rows. There are 3 site specific entries for each date. I have an image of the current output if required.
I want to be able to replace each null row in the date column with the value of the row above so that dates appear in every row.
Any help gratefully received.
Regards, Q
Hi Quentin,
Great question! There is a Fill Down function in Power Query that will fill the null rows with the value above. To use it:
1. Right-click the Date field column in the Power Query Editor.
2. Select Fill > Down from the right-click menu.
I just wrote a separate article that explains the Power Query Fill Down function in more detail. I also included an animated screencast there so you can see it in action. I hope that helps. Thanks!
Hi Jon,
This is a terrific post that I forward to my colleagues as an intro when they start working with Power Query.
I started having some problems since the update Excel 2016. All the queries I use are connected to SF Objects and generally merge 2 objects. In some cases I get errors as
a) “DataSource.Error: invalid query locator. Details: List”
When I scale a model existing for “Country A” with a query connected to SF, I usually duplicate it in another Folder with name “Country B” and change the filter in Power Query Editor that defines which country we download the data for.
Do you think changing the location of the file or duplicating them might be a source for the errors? In some files it’s still working, specially for my colleagues, that is the tricky thing.
If that wouldn’t be the error, is there other sources that could cause this?
Congrats again for the post & many thanks!
Cristina
Hi Cristina,
I haven’t experienced this error with SalesForce. You might want to try posting this in the Microsoft Answers forum. Thanks!
Hi Jon,
Thanks for the article.
I am an old had at Excel but new to the Power Query and PowerPivot features. I am still trying to work out he differences and when it is best to use one over another. (Perhaps there is a post in that for you).
My question is that I often get a similar error. I try to link two tables and instead of getting the relevant data to come through to each line I get a sum on every line.
For example, say I have a table with 1000 rows of sales data for two products, Product A and Product B, showing quantity sold. On the second table I have prices for two products, A is $10 and B is $15. I want to pick up the price on each line, multiply it by the quantity and get sales value. Instead of picking up the individual prices ($10 and $15) I get the total price ($25) for each line.
Any suggestions?
Thanks.
Hi Terry,
Thanks for the suggestion. You will want to use the Merge feature to bring the tables together. Then expand out the columns. You can then add a custom column to do the math. I’m not sure I fully understand your question though. What steps are you taking in Power Query right now to get the total price?
I have a table in Excel (can be in a data model if need be). This table called ACE can have 30,000 unique rows.
I want to compare this data to what is in our ODBC table, where that table has millions of rows.
I want to import the records from the ODBC tables doing a LEFT JOIN, so to speak, on the ACE table in my data model, Can that be done?
I know how to create a filter, and even use Design mode in PowerPivot to create a query, but i cant figure out how to do a “LEFT JOIN” to only pull in the the rows in the ACE table.
Thanks
Hi Jeff,
In Power Query you can use the Merge Queries feature to do a Join. The Merge window allows you to choose which join type you want to use. I hope that helps get you started.
Thanks!
Hi,
i have multiple queries i am going to run it on oracle database and fetch data. i have predefined filters on Name and id .
i added this name and ID In the excel table.
i can add this dynamic filter on the results of power query in advance editor,
but issue here is- it is fetching all the data to excel and then applying this filters.
1.Is there any way that we can apply this filter before fetching the data , i mean add this filter variable in actual query?
( i tried its throwing error as reference to other steps.)
2.is there any way that i can build my query in excel cell with all my dynamic filters and use this query in power query?
Thanks,
Vishnu.
Hi Vishnu,
I believe you are looking for a parameter table. Checkout this article from my friend Ken on parameter tables. Thanks!
Hi Jon,
I am encountering a problem where data that I have grouped by and summed does not exactly correspond to the value I get when using a Pivot table with the exact same grouping and summing parameters.
Why is this and what can I do to remedy the problem?
Thanks for a great article 🙂
Marius Gambold
Hi Marius,
It would be hard for me to tell without seeing the data. You might want to try posting to the Microsoft Answers forum if you think it is a bug.
Hello Jon,
I got stuck,
My powerquery has 9 excel files and I am doing some operations on that, It was running successfully but since friday when I try to run I’ts getting error like
[DataSource.Error]: The Web.Page function requires Active Scripting to be enabled in the Internet Explorer options. Please see …….mswebsite…. for details on how to enable Active Scripting.
I have checked about Active script on IE but It’s already active
However Its getting same error, I couldn’t process further
Can you please help on this error”
Thanks
Yogiraj
Do we have any Solution yet ? Jon
Hi Yogiraj,
I’m not sure about that error. With monthly updates coming to Power Query, it’s hard to keep up. Your best bet will be to post the issue on the Microsoft Answers forum.
https://answers.microsoft.com/en-us
Someone from Microsoft will be able to help you. Thanks!
Hi Jon
This Addin sounds very interessting.
Currently I am searching for an option to combine two Sharepoint-Lists, which I implemented as tables in Excel, into one to use it as a database for a Pivot.
Can you tell me, if everyone who uses that file afterwards also needs this Addon installed like if using PowerPivot for example?
Regards
Georg
Hi Georg,
They will only need the add-in if they are going to refresh or modify the queries. If they are just going to view the file and modify it’s formulas, pivot tables, slicers, then they won’t necessarily need the Power Query add-in installed.
Hi Jon
Thank for the info.
Meanwhile I tested it and came to that conclusion, too. Now I am waiting for our IT-Department to handle my ticket requesting the installaton.
This Addon could also end my longyear search for a stable functionality to link a standard pivot with two Excel-tables as sources.
Great!
Georg
Hello Jon,
I like your website and I want to say that it has been very beneficial to me.
However I have a really strange scenario going on with Power Query.
I added a Standard math column to multiply “Price to Sell” by the Qty.
I added sample data. I bought 2 of 2 different items.
Item 1 has a price of $9.39 to sell and Item 2 has a price of $16.12 to sell.
For Item 1 the query said that $9.39 X 2 is $9.39 and it then returned a product of $103.1928 for the second item.
I don’t understand why this is happening. I simply entered a standard math column asking it to multiply.
Any Suggestion or direction?
Thanks a bazillion…
Kevin D in Las Vegas
Hi Kevin,
I’m not sure why that would be happening. Sounds strange. You might want to try posting it on the Microsoft Answers forum.
Thanks again for your support. I’m happy to hear you are enjoying the site.
The request was aborted: Could not create SSL/TLS secure channel.
I am trying to connect to a state website to import data from the web using Power Query. I can connect to it with a browser and I can access the site using Excel>Data>From Web. Because the Excel option is limited I decided to try the Power Query add-on but get the message
“The request was aborted: Could not create SSL/TLS secure channel.”
when I try to connect. I am curious as to why this is. If Excel can reach the web page I need to query, why as an Add-on is Power Query having this issue?
Can anyone please provide a suggestion of what I can do to avoid this error? Is there any documentation for connecting to the web besides those I have found that make it look so simple and assume no issues?
Any suggestions will be much appreciated. Thank you!!
Hi JTR,
I’m not sure about this error. I would try posting or searching it in the Microsoft Answers forums. There are Microsoft employees there that will help resolve your issue. Thanks!
Good Morning Jon,
I am trying to prepare one file which need to formatted with some HTML tags and I don’t require that so I was trying to remove those tags but I couldn’t find a way here is requirement like
For example I want to make it only
Of course I can do it with Replace but there are so many other tags needs to be removed
like , and so on..
Is it possible ?
Good Morning Jon,
I am trying to prepare one file which need to formatted with some HTML tags and I don’t require that so I was trying to remove those tags but I couldn’t find a way here is requirement like “” to “”
For example I want to make it only “” to “”
Of course I can do it with Replace but there are so many other tags needs to be removed
like , and so on..
Is it possible ?
Sorry HTML format is not showing properly
Find Here probably
“””” to “”<td"" simple replace thing
Again its not proper
I want to make
“td class:…” to “td”
“tr class:…” to “tr”
Thanks for sharing !!
Hi
I am wondering if i can use power query feature to download all the data from 4 expendable sections (Key Stats, Annual, Quarter & market data) for the stocks on webpage ..
http://www.moneycontrol.com/stocks/data-bank/standalone/steel-large.html
I tried but so far no luck … 🙁
Dear Jon,
I am using Power Query for almost a year now and the tool helps me a lot with processing data. I have one question: I have an Excel file with data regarding sales from different countries. These need to be split into different sheets. For example I want to have a sheet for The Netherlands, United Kingdom, Italy, Spain and France. Do you have a quick solution to get these in different worksheets in one Excel workbook?
There is a column where the country is mentioned, so I am able to filter the data.
Thank you very much. This website is really useful by the way 🙂
You can make a pivot of your data and then use PivotTableTools>Options>ShowReportFilterPages.
To use this, you need to put Country in the filter section of the pivot table.
I have installed power query for excel 2010,but most of the easy steps are not possible with that version. How can upgraded to new power query version.
I.e combining multipule excel files process is difficult than new version as shown in the tutorials.
pl. help
Dear Jon,
I know something about power query this is very good tool to work on Excel and improve our productivity, but i have never work in power query yet.
Request you to please advise how i can get start this tool form begging.
it would be great help if you can provide some link of Videos where i can get learn quickly form starting.
if something else from your side to please suggest i want to be expert in Power Query because i’m also want to help others in theirs works as well.
Waring for your revert.
Thanks
Arun Kumar
From IND
Following the guidance from your 3 part video guide for creating dashboards from pivot tables and charts, a few months ago I set up a dashboard for data extracted from a SharePoint file for transactions processed on the SharePoint from Jan-Jun 2017. With the use of slicers Management are able to obtain returns for unit and personal performance levels, turnaround times, input, demand and output. They loved it!
I would export the data from SharePoint and save it on a worksheet in my workbook. After exporting the SharePoint data to excel, with the use of various formulas in individual cells, I was able to create my source data based on the exported data. Once a week I would update the source worksheet by exporting the fresh data again. I copied the cell formulas on my source data worksheet to create a range sufficient enough to include the additional data from each update. Once my source data was updated I would select a pivot table and use ‘refresh all’ to update the charts on the dashboards.
All was working well until a new SharePoint file was created for Jul-Dec which meant that I now have 2 sources of data for my source data worksheet. Following the process I had been using, I now have 2 worksheets in my workbook, one which is a copy of exported data for Jan-Jun and one for Jul –Dec, and my source data has been formulated to include both. I’m sure there must be an easier way to do this. Although all the required data is on the source data worksheet, the problem I am now facing is that when I select ‘refresh all’ I get the following pop-up messages for every worksheet that has my pivot tables:
‘A PivotTable report cannot overlap another PivotTable repot’ & ‘There is already data in ‘(worksheet with tables)’.Do you want to replace it.’ which ultimately removes most of my filters and deletes the respective slicers from the dashboard.
As I say, there must be an easier way to do this which is why I am seeking any positive guidance from yourself. Would Power Query be the answer? I work for a government agency and Power Query is not included in our MS Excel (2013) but if it would be the answer then I could submit a business case to have it downloaded.
I love your tutorials and have learnt a lot more from them than I have from the advance Excel courses that I have attended through work so any advice would be appreciated, Jon.
Many thanks,
Terry
I need a clarification on Filtered rows. I have applied filtered row in one of the query. Does the powerquery pull all the data from the specified table and then filter it or it pulls only filtered rows when I refresh.
Thanks in advance, request some expert to guide me. I want to minimize the time for data extraction, that’s my objective.
Hi Jon,
How to connect my FTP folders and get data file from that ?
I have tried with FROM WEB option but its getting error
Can you please explain process to connect FTP in Power Query
Same as is it possible to connect SFTP ?
I have successfully got info from an api using query. That gets the vehicle id and names and put then into sheet 1 of a workbook.
I want to step through the vehicle ids (688 of them) and use the selected id in a new query, in the api and get the details of the vehicle into sheet 2.
the api is https://api.worldoftanks.eu/wot/encyclopedia/tankinfo/?application_id=xxx&tank_id=3601
Now 3601 is the number that must be changed to the one im stepping through in sheet 1.
I have used power query and there are a few steps recorded to clean up the info. I can do this 1 vehicle at a time. I want to rather automate the process 688 times. Ant way to do this in vba?
bing got me here. Cheers!
I added a new list today. I changed how I scrape to get more results. Read my post for more details.
Thanks for this. We really appreciate your time and effort. This not only helps public but also provides a new perspective to the topic.
Hi. I see that you don’t update your blog too often. I know that
writing articles is boring and time consuming. But did you know
that there is a tool that allows you to create new articles using existing content (from article directories
or other blogs from your niche)? And it does
it very well. The new articles are unique and pass the copyscape test.
You should try miftolo’s tools
It good to see excel
There’s certainly a great deal to learn about this
topic. I like all of the points you have made.
Hi Jon, late to this post by a few years, but I’m wondering what/if any advantages there are with Power Query to regular old MS Query in my scenario. Our ERP is on an SQL database, and I really only have one source for data (no Facebook analytics coming in!). We’ve been using MS Query up to now. Our versions of Excel don’t have Power Pivot, so I can’t utilize that either (and again- what’s wrong with regular old pivot tables and charts?). I’m just exploring whether upgrading will have a payoff. Thanks!
Scenario:
I’m using power query to import a data set to an analysis workbook from another excel source data workbook. I import the data and save it as a connection only. From the connection I then run several other power queries that load data to a worksheet. I want to send the analysis file to users, but not the source data file.
Issue:
When the analysis file can no longer access the source data file, the source data still shows in the connection preview, but refreshing the other queries that load data to the worksheet do not return data. I initially thought the raw data was saved somewhere in the analysis file (hence how the preview can display data), but I now suppose it does not, but instead, that it has to refresh the connection every time a sub query pulls from it.
Question:
Is there a way of importing the raw data to the query so that it stays in the connection and does not need refreshing when a sub query runs? I’m hoping I do not have to load the raw data to a worksheet to achieve this as it will increase file size (maintaining a smaller file is one of my goals)
I have a workbook that contains a data source built on a separate worksheet and it contains many pivot tables and a dashboard. We recently made some major changes to the source worksheet to include a new campus for our church. After updating the power query and creating several different queries that are merged I need to change the source for my pivot tables and dashboard. When I attempt to change the source I get a message that “The data source of a PivotTable connected to filter controls that are also connected to other PivotTables cannot be changed. To change the data source, first disconnect the filter controls from this PivotTable or from the other PivotTables”
I removed the slicers and don’t see any filters. Where do I need to look?
Thanks for any help you can provide.
Good info. Lucky me I ran across your site by accident (stumbleupon).
I have saved as a favorite for later!
I have a nagging problem in the power query editor and connecting tables. In the cleaning process in power query for What will become a dimension table I remove duplicates in the column that will link to my fact table, or so I think. When I go to create the connection in the data model I get the error that there are duplicates. This happens frequently. The step to remove duplicates in the selected column does not remove the duplicates. I load and refresh everything but I have the same amount of rows after the remove duplicate step is applied, thus no duplicates are removed. I must be doing something wrong and/or I don’t understand the remove duplicate behavior. Further, I don’t know how to investigate the problem in the power query editor when my data contains more rows than can be previewed. Any wisdom would be greatly appreciated.
Hii sir pivo talble overdue filters not working so u can reply how to overdue filters working plse reply
hi Im working on monthly basic on the data up to 200 000 records.can Power Query help to handle such quantiy of records?
I am a heavy user of Power Query … really good way of mashing data together before resorting to PowerBI. After all if no visuals needed then why use PowerBI? Also a good way of giving PowerBI a consistent file path and file name to find.
Thank you Chris! I’m happy to hear you are using Power Query so heavily. Awesome! And one additional benefit of learning Power Query is that it is part of Power BI. So your knowledge and skills are directly transferable between Excel and Power BI.
Thanks again and have a nice day! 🙂
Thanks for the Power Query intro, Jon. Should one learn Power Query before delving into Power BI?
Thanks Joe! Great question!
The short answer is yes. Power Query is a feature within BOTH Excel and Power BI. So learning Power Query will benefit you in multiple ways.
I explain more about all of these tools in my free webinar called The Modern Excel Blueprint. You will learn how they all fit together and which ones to use for specific projects and workflows. Here is the link to register for the webinar.
https://www.excelcampus.com/blueprint-webinar
I hope that helps. Thanks again and have a nice day! 🙂