Bottom line: Learn how Power BI, a brand new tool from Microsoft, will change how you visualize and share your data. Plus, it's FREE!
Skill level: Beginner
If part of your job is to create charts and dashboards, well your job just got a whole lot cooler! 🙂
I am really excited about this new tool from Microsoft. Power BI allows you to create interactive charts and dashboards using the Power BI Designer application.
The best part, it's all completely 100% free! I still can't believe this…
Power BI Overview Video
In the following video I explain PowerBI.com and the Power BI Designer. You just have to see it in action!
Best viewed in Full Screen HD.
Power BI Explained
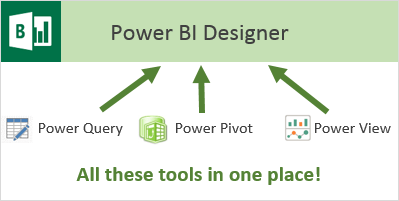
What exactly is Power BI? You've probably heard of Power Query, Power Pivot, and Power View before, and know those as add-ins for Excel.
Well, Power BI is a new application that brings all these tools together in one place.
The Power BI Designer is a separate application outside of Excel. You basically use this one app to bring in your data and create all the charts and reports.
You can then publish the reports to PowerBI.com to create dashboards and share them with anyone.
Process Overview
Here is a high-level overview of how Power BI works.
Step 1 – Get the Data & Prepare it for Reporting
The first step is getting data. You can bring data in from just about any source including Excel, databases, web pages, and much more.
The Power BI Designer basically uses Power Query to get data. So if you have used Power Query before then you will feel right at home with the getting data in the Designer.
You can also transform your data just like you would in Power Query in Excel. It's the exact same tool.
So processes like filtering, removing blanks, splitting columns, unpivoting, and merging data are very easy to do. Power Query allows you to create a system and automated process.
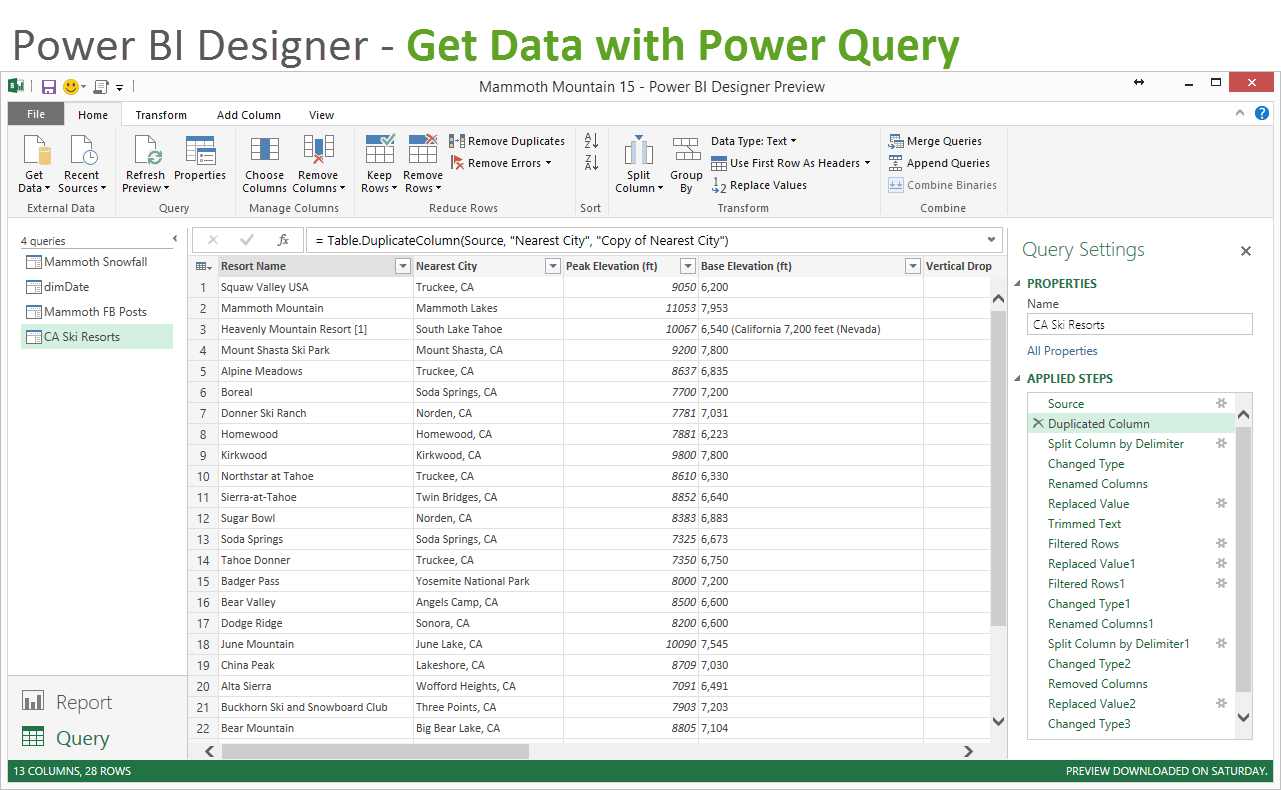
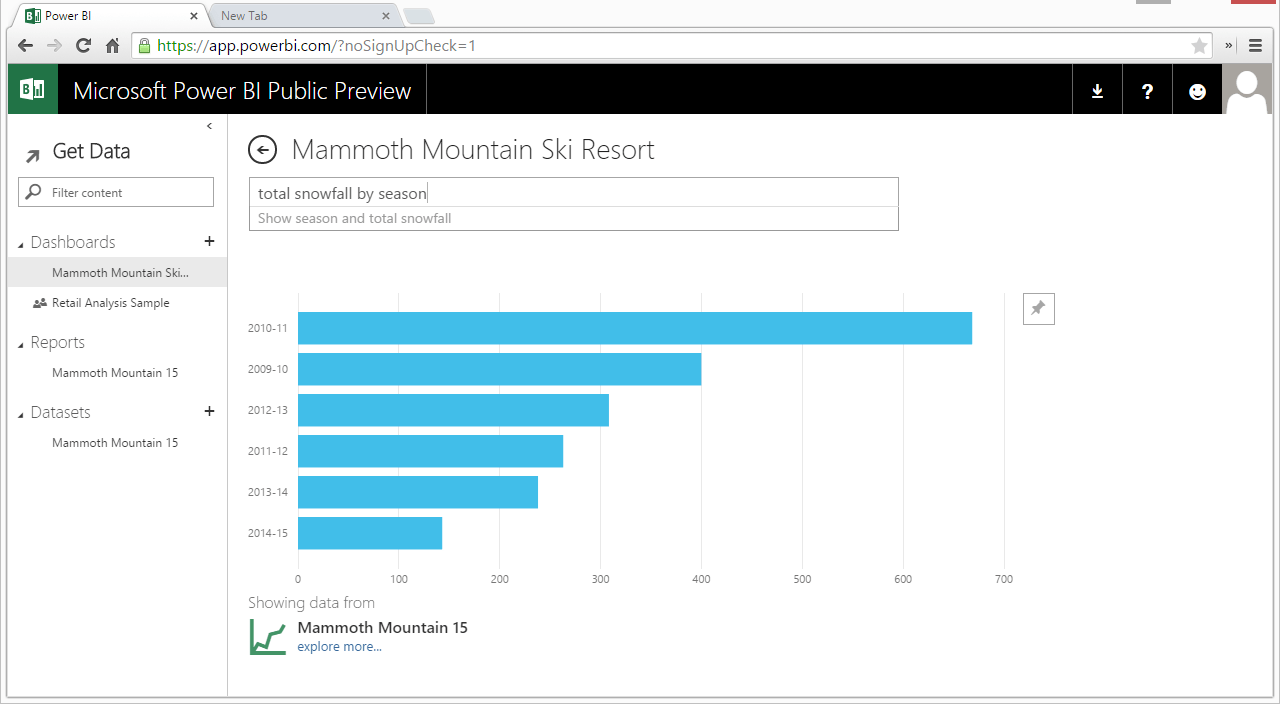
In the video I bring data for Mammoth Mountain Ski Resort from three different sources.
- Snowfall history from their webpage.
- Facebook post data from their Facebook page.
- California ski resort data from Wikipedia.
Checkout my Overview of Power Query to learn more about this incredible tool and all the places you can get data from.
Step 2 – Create Reports – Calculate & Visualize the Data
Once you have your data you can start creating reports. This is somewhat similar to creating Pivot Charts in Excel.
The field list is on the right side of the Report window, and you can choose from quite a few different chart types to display your data.
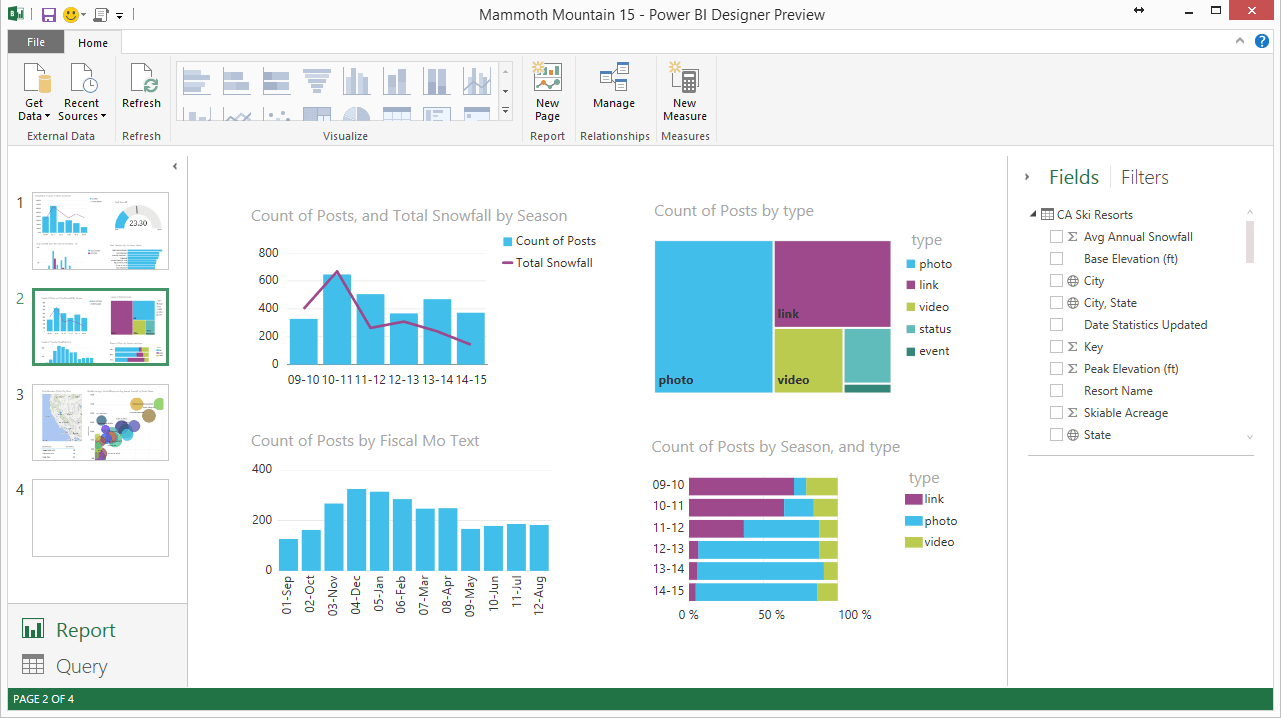
You can also create relationships between your data tables and write DAX measures (formulas). This is the same process you would do in Power Pivot, but it's all right here in the Power BI Designer. This makes it an extremely powerful tool, and will allow you to create some very advanced analytics between data sets.
Step 3 – Share With Anyone
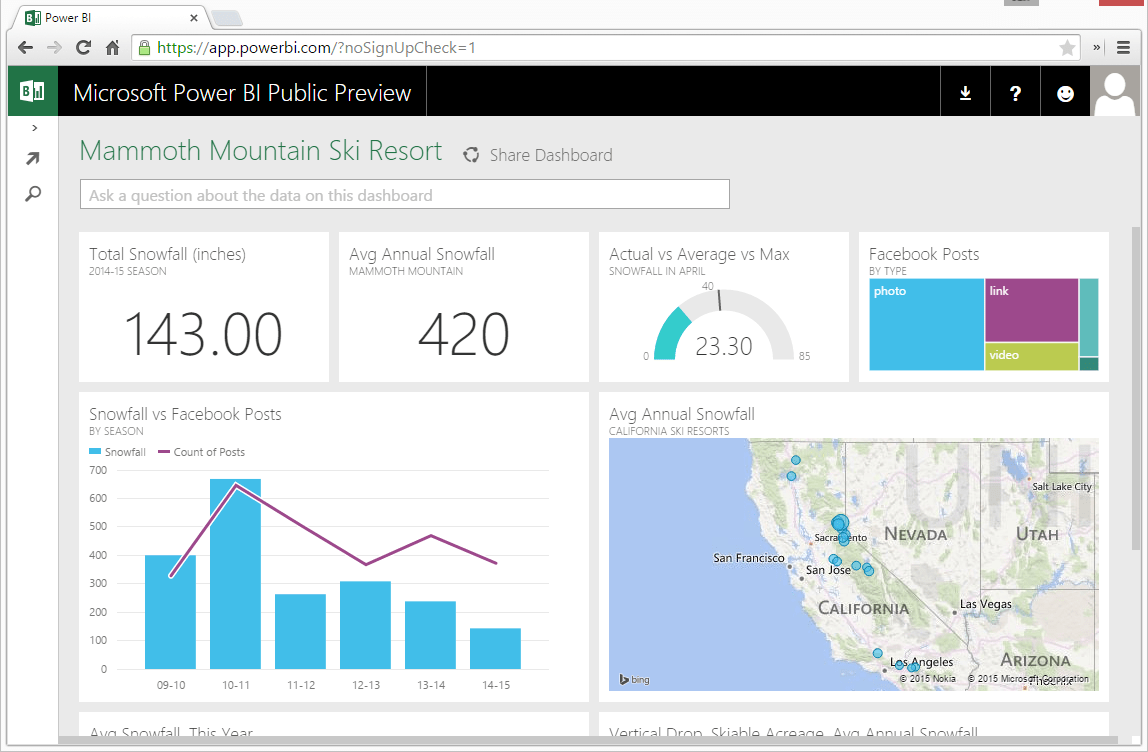
Once you have created your reports in the Power BI Designer, you can then upload them to PowerBI.com to share with anyone.
This is a fantastic feature because it instantly makes your reports consumable by anyone with an internet connection. You can even get the Power BI app for iOS and view the reports on your iPad or iPhone. Believe me, the boss will love this!
PowerBI.com is loaded with features:
- Interactive (clickable) reports that filter the other reports on the page as you click.
- Q&A Box that allows you to type questions about your data and get visual answers in the form of charts.
- Dashboards that summarize all your reports in one place for quick viewing.
- The ability to update and edit your charts.
- The ability to refresh your data and schedule refreshes from your data sources.
- Share your reports and dashboards with anyone.
Power BI is Amazing!
Power BI really is an amazing tool, and not just because it's free. It brings a whole new way of visualizing and sharing your data. And it might also help put an end to some boring Power Point presentations…
I will be sharing more about Power BI in the future, but I encourage you to head over to Powerbi.com to check it out. You can download the Designer there (it's also free) and start creating dashboards.
Please leave a comment below with any questions. Thanks!
Power BI Dashboards & Data Online Course
This is an online course that uses my step-by-step hands-on learning system. You will follow the video lessons and build an interactive dashboard for a ski resort company.
Learning Power BI will help you stand out from the crowd and become the data superhero of your organization.
The course will equip you with the most important skills to help you get up to speed and start creating your own dashboards.


Great overview, Jon. It’s great to see these tools start to come together. Do you know if Microsoft intends to keep Power BI free indefinitely?
Thanks Dave. I believe there will always be a free version, but don’t quote me on that… 🙂
Hi Jon
Sorry to be a bit ‘anal’, but you have a typo in your heading “Power BI Desinger” you might want to correct 🙂
Thanks Paul! I really appreciate you letting me know! Have a great day 🙂
Jon –
you cannot share Power BI reports with “anyone”, only with (paying) members of your organization. This product is not available/affordable for private customers.
Hi Frank,
You are right that currently you can only share with people in your organization. However, you do not have to pay to create the dashboards, or have others view them. Here is a link to the pricing page with more details.
https://powerbi.com/dashboards/pricing/
Power BI is still in preview. I’m not sure how the sharing will work once it is out of preview. I agree that it would be nice to be able to share publicly. You can definitely cast your vote on the support page to help get these features added to the product. Thanks!
https://support.powerbi.com/
[…] on the website will help you get started, and to learn more about it, before you register, read Jon Acampora's overview, and watch his video […]
Wait a minute…requires Professional Plus versions, right? If so, then I’d hesitate to call this ‘free’. Because if that’s the case, I can’t rock up with my non premium version of Excel and say “Can I have your free PowerBI with this, please?”
Free to me means “It works on all versions of Excel, and not just the premium version”
Hi Jeff,
In this case free means you don’t even need Excel. I know, it’s hard to believe.
For powerbi.com all you need is an internet connection.
For the Power BI Designer you currently need Windows. It is a free download. There is no Mac version yet.
The Power BI Designer is NOT an add-in for Excel. It’s a standalone application that has Power Query and Power Pivot built into it. And it’s free!
No Excel required. Can you believe it? 🙂
Hi Jon,
Is it possible to make a measure that calculate the percentage of revenue in the PBIX file you made for mammoth mount example of sales data.
I have tried the measure formular, but it doesn’t seems to work when you make a filter/split on eg. the buidlings. The measure formular I have tried is: = Revenue % = ((‘tblSales'[Revenue percentage] / SUM(tblSales[Revenue]) * 100))