Bottom line: Learn how to use the different calculation types to quickly answer questions about your data. I also explain how to update your pivot table with more data.
Skill level: Beginner
Video #2 – Investigating Your Data with Pivot Tables
Downloads
Download the Excel file to follow along with the video.
The following file contains the additional data that I add to the pivot table source data in the video.
Pivot Tables Answer Questions About Your Data
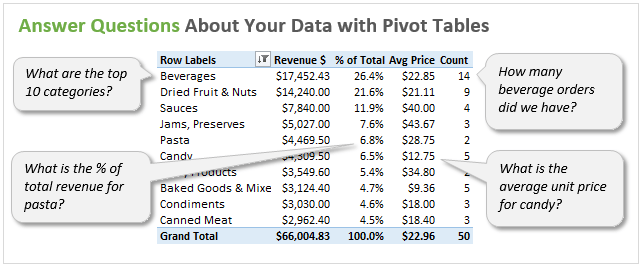
This video is all about learning how to answer questions about your data. As we learned in the first video, Pivot Tables allow you to quickly summarize your data. Since we don't have to spend time doing this manually, we can focus more of our efforts on discovering trends and analyzing our data.
Here are some of the questions we answer in this video:
- “What are the top 10 product categories?”
- “What is the average unit price for each category?”
- “How many orders did we have for each category?”
- “Who are the sales reps selling in each category?”
- “Which categories make up over 50% of our total revenue?”
We can answer all these questions in a matter of seconds with a Pivot Table.
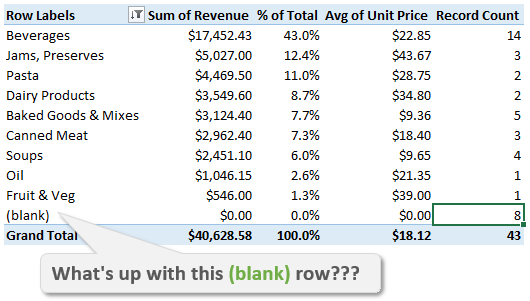
I also explain how to investigate your source data. Our Pivot Table contains a (blank) row, and I show you why this is happening and how to fix it.
Update Pivot Tables with More Data
When you receive new data periodically (week, month, year) you will want to update your pivot table to include the new data. To do this you have to Change the Data Source range of the Pivot Table to include the new data.
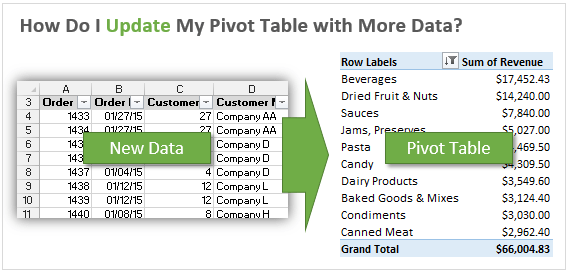
I explain how to do this in the video and show you a few shortcuts to make this process faster. I also explain how to make changes to your source data and refresh your Pivot Table to display the updates.
Keyboard Shortcuts Used in the Video
Here is a list of all the keyboard shortcuts I used throughout the video. I love keyboard shortcuts! 🙂
- Ctrl+Drag Right with Mouse – Copy/Duplicate a Worksheet
- Alt+; (semicolon) – Select Visible Cells
- I just added a new feature to Paste Buddy that allows you to paste to a range with hidden cells.
- Ctrl+Enter – Fill Values/Formula to Selected Cells
- Alt+F5 – Refresh Pivot Table
- Ctrl+Shift+End – Select Cells to Last Cell in Data Range
- Ctrl+Down Arrow – Go To Last Cell in Column
- Ctrl+A – Select All Cells in Data Range
- Alt+A+C – Clear All Filters
Filter Pivot Table Source Data with PivotPal
In the video I show a few features of PivotPal that make it easier to work with your source data.
PivotPal has a Filter Source button that allows you to quickly filter the source data sheet. It filters the source data for the details of the selected cell in the values area of the pivot table.
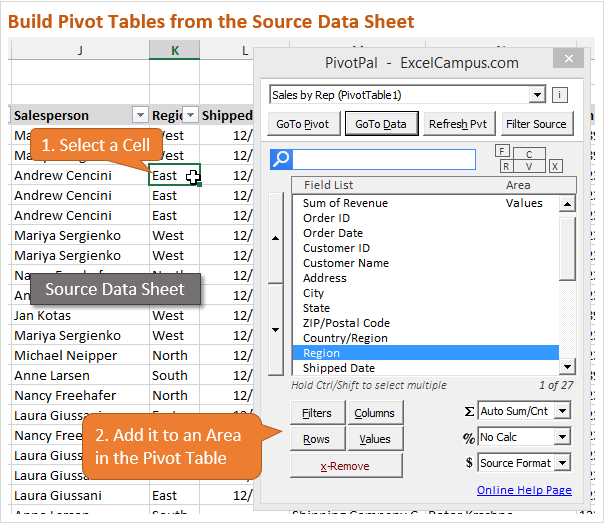
I also show how you can build pivot tables while on the source data sheet. This saves a lot of time from flipping back and forth between your source data and pivot table sheets.
PivotPal is now available!
Click here to learn more about PivotPal!
Additional Resources
- In part 1 of the series we learned how to setup our source data and create our first pivot table and chart.
- In part 3 of the series we create the dashboard and add slicers to make it interactive.
What Do You Think?
Please leave a comment below with any questions or suggestions. Thanks!


enjoyed this one….good short cut tips
looking forward to #3 and slicers
thanks!
Thanks Pam! 🙂
Thanks for these very usefull tips. Still haven’t found the solution for my pivot problem, but already looking forward to the next chapter. 🙂
Hi Rob, What is your pivot problem? I’d love to help. Thanks for the comment! I’m glad to hear you are enjoying the videos. 🙂
Will PivotPal support LibreOffice?
Hi Sigmund,
No, I don’t believe so. I have not used LibreOffice yet so I’m not really sure. Does it support VBA? Thanks
Hi Jon, Thanks for providing such wonderful tutorials. God Sent!! I got stuck on Pivot Table #2 video the first segment, ‘Top 10 Categories chart’. I use Mac Excel 2011, somehow the chart does not update with the pivot table, it remains the same as that for ‘sales by Rep’ and the data source stays with the original pivot table not the new one. Does Mac version lack the capacity to auto update a chart when the pivot table changes? I tried for a long time to no avail.
That’s a great question. Unfortunately pivot charts are not available in Excel 2011 for Mac. You can use a regular chart and choose the pivot table as the source data range. The only issue with this is that if the pivot table changes size (more rows/columns) the chart will not include those new rows/columns. However, you could use a dynamic named range as a workaround for this. I hope that helps. Please let me know if you have any questions. And thank you for the wonderful comment!
These videos are very concise and easy to follow. Thank you for developing them.
Thank you Dan! I really appreciate you letting me know! 🙂
Great video
Thanks Don!
Greetings from India Sir 🙂 I have seen so many Pivot Table videos but you are simply awesome.
-The way of your teaching is nice and different.
-I have never heard the keyboard Shortcuts that you have used in this video, i really like them.
-Do you have a separate video for some awesome Keyboard Shortcuts like these?
– I am looking forward to watch all videos.
-Thank You for your help.
Hi Rishabhsharma,
Thank you for your comment. I really appreciate that and I am happy to hear you are enjoying the videos.
I have another video series that contains a lot of shortcuts for working with the worksheets in your workbooks. This video series is for my Tab Hound add-in, but I also explain a lot of useful shortcuts that are built into Excel.
I also have a six part video series on how to navigate Excel with the keyboard. This is a bonus with the purchase of Tab Hound.
And I have a ton of articles on keyboard shortcuts. It’s one of my favorite topics. 🙂
https://www.excelcampus.com/keyboard-shortcuts/
Please let me know if you have any questions. Thanks again!
Great tutorial Jon. But I am experiencing a very strange phenomenon. I am using my own set of data to make a similar dashboard for practice. When I create my first PT in a new tab, everything goes according to plan. The PT is created and I am able to easily create a PivotChart to illustrate my data (in preparation for creating a dashboard)
As in the video, rather than start a new PT I copied the 1st tab (just created) for modification that will lead to a second pivotchart. But as soon as I make ANY modification to my new (2nd) tab, the 1st tab changes as well.
I tried creating a new tab from the raw data tab, and have the same phenomenon. Changes to any new, or copied, tab with a pivot table changes the pivot table and pivot chart in the previous tab.
I have created several dashboards but this is the first time I have encountered such a strange phenomenon. Can you shed some light on this issue?
Thanks. And thanks for these nice tutorials.
Hi Bob,
My apologies for not getting back to you sooner! I didn’t see your comment come in. Anyways, that is weird behavior. What version of Excel are you using? If possible, can you send me the file? [email protected].
Thanks!
Outstandng tutorials Jon thank you so much for providing them. A wealth of knowledge to learn for sure but simple enough for beginers to learn. I’ll have to watch the videos over and over to eventually learn plus I downloaded the worksheet so I can practice. Thanks again.
Thanks David! I’m happy to hear you are learning. Awesome!
Great video tutorial. Thank you
Thanks Igor!
Hi Mate. Thanks for this tutorial. But I’m experience a little problem. When I make a duplicate of the main source or from your tutorial the “Sales by Rep” sheet, the chart from the duplicate (Sales by Rep (2)) is still link in the main source (Sales by Rep). How can I make the data of the chart in the copied sheet be linked in the data on the copied sheet? In short, how can I make a copy of the same sheet without any link from the original? Thank in advance.
By the way, the video or tutorial is great.
Great tutorial. Thanks so much Jon.
Thanks a lot for everything.
Amazing!
I saw other video tutorials about pivot table, your video tutorial is the best! Thank you for those free stuff!
Hi. Now I figured out how to see all of December in the category but where did you store January? I don’t see it on my sheet! Sorry.
Hi Jon,
I have just watched your 2nd videos. Its really interesting and very useful specially using Pivotpal.
I like your way to present, also you make bivotbmore easier
Nice, it”s very good for me to learn more and get the experience!
thank you for the knowledge
Very helpful! Great tutorial!
Thanks Trixie!
Hello sir
I Like your videos very much and they are very helpful. I m using Excel 2007 and after copying “Sales By rep” while i m trying to change salesperson to category, data is changing in PT but in Pivot Chart there is no change. Pivot table is still linked to Old sheet (Sales by Rep). Is this function support 2007 version?
Hey Jon,
Thank-you so very much. I am new to excel world but am learning and enjoying your videos. So far I have completed 2 videos of pivot chart and I cant believe I created many files following you . I cant believe it. Thanks to you
That is awesome Nirali! I’m so excited to hear that you are creating pivot tables. They are addicting… 😉
Thanks for the great feedback and have a good one!
Outstanding…
Thanks Mike!
Thanks very much for creating these videos. This was a great intro to pivot tables. The step-by-step instructions and demonstrations were clear and I learned a lot about this powerful functionality.
Awesome! Thanks for the nice feedback Nancy! I’m happy to hear you are learning pivot tables. 🙂
Thank you Jon for these wonderful videos. I just love how Pivot Pal is simplifying the work. I’m as mesmerised as Andy is and enjoying the videos even more. Keep it up!
Thanks for your support Awuor! I am happy to hear you are enjoying the videos and having fun too. Pivot tables are awesome! 🙂
Hi Jon,
Thanks for the great work. The videos are on point. self learning. This is what i call my Learning Pal. Just like the PivotPal
Thanks a bunch
Awesome! I love it! Thanks Ahmed! 🙂
Thanks for another easy to understand & follow video, Jon!
Glad you enjoyed it. Thanks Pat! 🙂
Thank you so much for making it very easy
Thanks Stella! 🙂
Thank you so Much for this wonderful video. God Bless you
thanks alot
Jon Sir,
Thanks a lot.
Good tutorials, thanks. It got me exploring with pivot tables. What version of excel(office) do you use in the turorials?
Thank you Geoffrey. I am using Excel 2013 in these tutorials.
thanks… is well appreciated
Hi Jon,
Thanks for the tutorials – very helpful!! I do have one query that I hope you can help with please…
I can copy across the pivot table using your method without any problems (i.e. click + cntrl c, drag and let go). The copy of the work sheet is created OK. However, whenever I change the data in the pivot table, it doesn’t change it in the pivot chart. So for example, if I make a copy of the ‘Sales by Revenue’ worksheet, and then want to change the value in the ‘Row Labels’ section from Region to Order Date, the Pivot Table updates itself with the Order Dates, however the Pivot Chart still has the Region data in it.
I’ve tried refreshing but that doesn’t work. Am I missing something?? It’s probably something small, but can’t see where I’m going wrong!
Thanks,
Matt
Hi Matt,
I’m not sure what would be causing that. What version of Excel are you using?
Hi Jon,
I’m using Excel 2007. I had an Analysis test at an interview the other day which focused a lot on Pivot tables (hence the reason why I was watching your tutorials!) – I tried the same thing on their computer as well and again, the same thing happened. I also believe this was on Excel 2007. So not sure if this shortcut only applies to Excel 2010 + ??
Thanks,
Matt
Hi Jon,
Thanks a ton, the video was a great help, do you have more videos in learning formulas and data validation and tools i can use in MIS.
Regards
Rashmi
Hi Jon,
Thanks very much for these 3 starter lessons, they have nicely and clearly de-mystified pivot tables for me.
Phil
Awesome! Thank you Phil! 🙂
Very much enjoying your video’s and the data downloads which go along with your tutorials.
Great job, fella.
Thank you Simon! 🙂
Hi Jon, Thank you so much for these wonderful videos! They’re so clear and helpful. One follow-up question for you: I wanted to start from scratch as practice so I copied and pasted just the values of the “data” tab into a new workbook, and then I created a pivot table from this data successfully. However, I was not able to get the drop down options at the top of each column on the “data” tab in my new workbook. Would you be able to tell me how to get these drop downs to appear? Thank you so much!!
Hi Lucy,
Those are Filters. I have a 3 part video series on Filters that you might like.
Jon, your video is so helpful! I have bookmarked it so that I can refer to it quickly. You are making it so easy to learn how to use this function. Also, PivotPal looks like a great tool!!
Thank you Nancy! 🙂
It’s great! Thanks for this video learning tips it is very helpful. Keep on sharing with us Sir, Have a nice day!
Thansk so much, Jon, for these turiorials.
They have been quite helpful.
Thanks again.
Great tips and step-by-step instructions. Thanks so much! Need Video #3 for my Business Analytics class asap.
Really looking forward to learning more…you make it look easy!
Great tutorial. I have recommended your tutorials to others. Thank you !
Hi John!!
You have got me hooked on all things that pivot or even rhyme with pivot! Seriously – I am at 36 hrs w/o sleep working on a Dashboard to post on SharePoint. Thanks to you – I have the Dashboard stuff more than covered, H O W E V E R… How would I invoke a process or whatever that would grant me a text area for sharing with managers the steps involved as well as the holdups that we encounter with some of our internal processes?
I tell many of your mentoring/teaching skills. The word is getting out.
Thanks, Jon!
Hi Tom,
Thank you for the nice feedback! I’m really happy to hear you are learning and enjoying pivots. 🙂
I’m not sure I understand your question. Are you wanting to add a text box to the sheet with instructions? If so, you can do that from the insert menu by inserting a text box shape. I actually explain that in my latest videos on the Doughnut Progress Chart. This is another chart you might want to use in your dashboards in the future. I hope that helps. Let me know if I did not understand correctly. Thanks again for your support! 🙂
Thanks for the first video (#1). I really enjoyed it that I earnestly look forward for the second video. knowledge packed tutorial. thanks again Mr. Jon.
Thanks for The Second Video.
Appreciated.
Great tutorial. Thanks.
Question: In my version of the spreadsheet, everything seems to match and thanks to the tutorial I am able to perform the various steps explained.
However, for some reason, the Blanks, despite appearing in and being selected in the various filters for Source Data and Pivots does not show up in the Pivot Tables.
What am I doing wrong?
Really great information, well presented … makes you want to go to the next level. Maybe slow down the pace just a little bit to leave time for people to actually apply the functions. Thank you. Until soon.
Excellent presentation, very informative.
Ernie
Hello,
Thank you for your videos, sincerely.
I just wanted to ask this small question, why i can not see all the data when i download it. I just see december?
Thank you!
hello Jean, There are actually 4 files
Intro to Pivot Tables (parts 1 – 3)
and Sales-Data-for-January-2015
https://www.excelcampus.com/charts/pivot-tables-dashboards-part-1/
https://www.excelcampus.com/charts/pivot-tables-dashboards-part-2/
https://www.excelcampus.com/charts/pivot-tables-dashboards-part-3
Part 2 website has 2 files.
Hope this helps!
Terrie Marie
Ron,
Thank you for these informative videos. I refer people to them often and several of my associates have purchased PowerPivot.
Common requests I hear from some of our more advanced users:
We get data from several sources (say 2 as an example, updated regularly). Each of these is in its own worksheet.
There are a number of additional columns which get populated on this data, some through data profiling, cleansing, validation, and lookup results elsewhere. Let’s call it “additional attribution” from several sources, including users.
These 2 worksheets, each with their “additional attribution”, are combined, and additional attribution is added to their combined results (user inputs). This final combination powers sales planning, ops, and is reflected in several dashboards.
Do you have a more involved tutorial(s), free or paid, which could address this? The design aspects of this are important, especially for the regular updates. We have healthy debates about whether Pivot Tables are appropriate in this situation, with the punch line being “they get us 90% of the way there” and then we have to do something different. Spreadsheets are 150+ worksheets, 30MB. Lots of macros and VBA, much of it legacy and incrementally modified.
Please point me to materials that you provide or services that you offer.