In this post I will explain how you can use Power Pivot instead of VLOOKUP to save time and analyze your data in new ways.

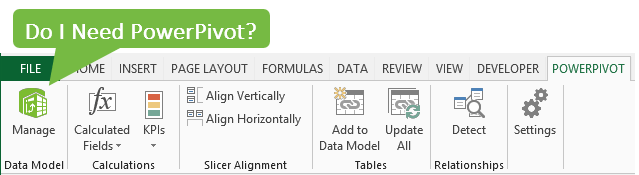
What is PowerPivot?
Power Pivot is a free business intelligence tool from Microsoft that allows you to process and analyze large data sets in Excel. It has a ton of great features, and here are some of the highlights of Power Pivot.
- Work with large data sets (over 1 million rows) right in Excel.
- Quickly create relationships between data tables, similar to a database.
- Analyze your data with Pivot Tables in Excel, an environment you are familiar with.
- Create advanced formulas and measures to analyze data like never before.
- Link Excel files directly to your databases and data sources to quickly refresh your reports.
- Go beyond Pivot Tables and retrieve data with the CUBE functions, great for custom reports, charts, and dashboards.
There are many more features of Power Pivot, and this list is just meant to give you an idea of what it can do.
Why Do I Need Power Pivot?
You might be thinking… “All those features you listed sound great, but do I really need Power Pivot? It looks like a lot to learn and I'm not sure how it will benefit me.”
So I'm going to give an example of how you can use PowerPivot instead of VLOOKUP, and let you be the judge. This example only scratches the surface of Power Pivot's capabilities. But you will see how Power Pivot makes it much faster and easier to create and maintain relationships between data sets in your Excel files.
The good news is that Power Pivot is a free add-in for Excel 2010 and 2013 for Windows. So there is no risk in trying it out.
A Common Reporting Process
Does the following process look familiar to you?
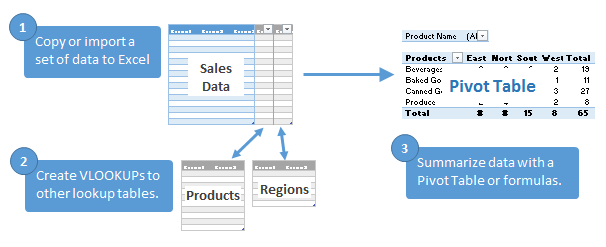
This is a common process we go through to summarize and analyze a data set:
- Copy or import a set of data into Excel. In this example we are going to use a set of sales data.
- Add additional columns to the data set to pull in additional information, usually with VLOOKUPS.
- Summarize the data with a Pivot Table or formulas (SUMIF, COUNTIF) for reporting.
If you do this process regularly, then I think you're going to like Power Pivot.
The VLOOKUP Approach
In this example we have a set of sales data that we need to do produce some reports for.
The data table does not contain the Product Category information, so we need to lookup the category from a Category table using VLOOKUP formulas. Then we will be able to create a report using a Pivot Table that shows the sales by Category.
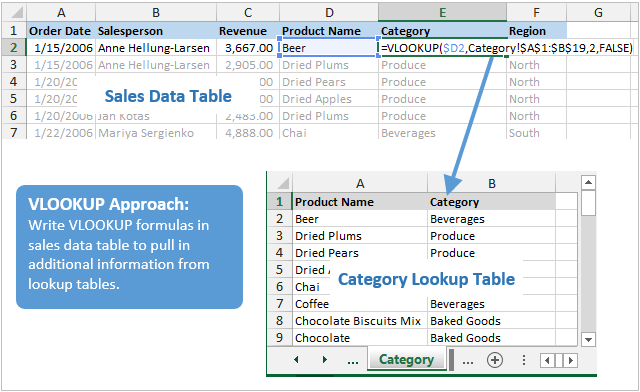
With the VLOOKUP formula we are basically creating a relationship between the data table and lookup tables. The question then becomes, how much is this relationship costing you?
Do You Have a Love-Hate Relationship with VLOOKUP?
There is nothing wrong with the VLOOKUP approach, but this relationship does require maintenance. Here are a few examples of things you might find yourself doing with the VLOOKUPs:
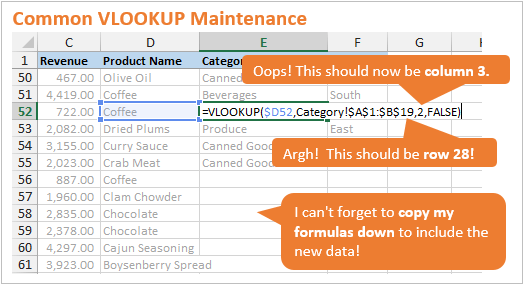
- Extending the lookup range argument (table_array) when you add more rows to your lookup tables. (Note: Excel Tables and structured reference formulas resolve a lot of these issues and I highly recommend learning about Tables)
- Adding an additional column to lookup table means the column index argument needs to be updated.
- Copying VLOOKUP formulas down to extend to the end of the data set after updating with new data.
I could probably list 10 more issues we encounter with VLOOKUP maintenance, but this post isn't about complaining. It's about solving the problem. 🙂
VLOOKUPs Require Maintenance

I like to think of the VLOOKUP as that old green truck. It's usually reliable, and you've depended on it for years, but it does break down from time-to-time. You either know it so well that you keep a checklist of potential problems (along with your toolbox) in the back of the truck, just in case something goes wrong (errors). Or, you have to take it to the mechanic (the Excel expert in your office) because it broke and you're not sure how to fix it.
Again, there is nothing wrong with the VLOOKUP approach. It can be a love-hate relationship, but VLOOKUP will typically get the job done.
Power Pivot to the Rescue
Here's an example of how quickly you can create the same relationships in Power Pivot.
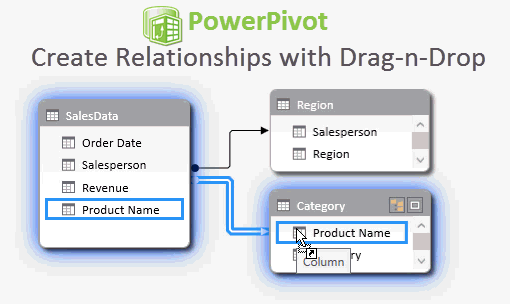
Click here to see the screencast animation in your browser.
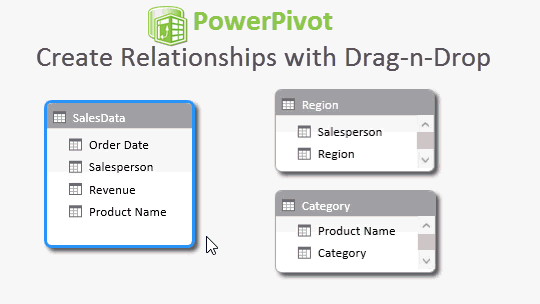
Power Pivot allows you to create relationships between tables with a simple drag-and-drop. This means there is NO formula to maintain here, and it is much faster and easier to build relationships between your tables.
In the screencast above, I am basically doing the same thing as creating a VLOOKUP formula. But all I have to do is drag-n-drop the field names between tables, and the relationship is created.
This is not to say that Power Pivot is completely maintenance free, but the relationships between tables are automatically updated when rows are added/deleted from the tables. You can also insert/delete columns to the tables and the relationships will remain intact.
The PowerPivot Pivot Table
Once we create the relationships between the Data table and lookup tables, we can then summarize the data with a Pivot Table.
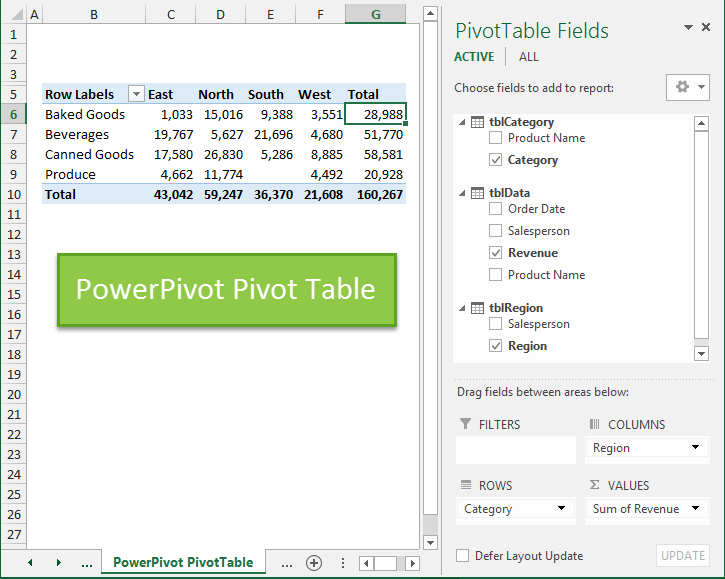
The image above is an example of a Pivot Table that uses a PowerPivot data model as it's source. As you can see, it looks very similar to a normal Pivot Table. This makes it easier to understand and work with.
Power Pivot Brings a Whole New World (Inside Excel)
One of the major benefits of the Power Pivot Pivot Table is that you can write Measures (DAX Formulas) to further analyze your data. Some examples of these measures could include: daily average sales, year-over-year sales growth, sales vs industry metrics, and much more. The possibilities are seemingly endless, and it's really only limited by your imagination.

I like to think of Power Pivot as that sleek new sports car. It's fast, powerful, and fun. Once you learn how to drive it, you'll begin to realize what it's really capable of. It will take you to new places that you only dreamed of before.
Who Wins?
I am NOT advocating that you should ditch the VLOOKUP method at all. It is still very useful, and one that every analyst should know. There are times when the VLOOKUP will suit your project just fine.
However, if you are constantly updating data sets with copy/paste, maintaining formulas, or finding yourself at the limits of your pivot tables, then Power Pivot is a great option. This new technology will really take your work, and career, to the next level.
Free Training Webinar on the Power Tools
Right now I'm running a free training webinar on all of the Power Tools in Excel. This includes Power Query, Power Pivot, Power BI, pivot tables, macros & VBA, and more.
It's called The Modern Excel Blueprint. During the webinar I explain what these tools are and how they can fit into your workflow.

You will also learn how to become the Excel Hero of your organization, that go-to gal or guy that everyone relies on for Excel help and fun projects.
The webinar is running at multiple days and times. Please click the link below to get registered and save your seat.
Click Here to Register for the Free Webinar
What Do You Think?
Could Power Pivot help you with some of your financial models? Please leave a comment below with any questions. If you have used Power Pivot, please let us know how your journey is going.
Thank you!


Jon: Powerpivot is Free in Excel 2010 but not baked in. i.e. you have to install an add-in, and this ain’t exactly intuitive.
PowerPivot is NOT free in Excel 2013, but baked in to the Professional Plus version or some Office 365 plans.
Thanks Jeff! I will put an asterisk next to that statement and ref your comment. Just to prevent any confusion, PowerPivot is included in some versions of Excel 2013. At one time I heard it was included with the stand alone desktop version, but I don’t know if that is still true. It is definitely a bit confusing.
After reading this, it seems to me that PowerPivot brings Access capabilities inside Excel. How is the user experience affected if you send a PowerPivot spreadsheet to someone who doesn’t have it installed? That would be my main concern as it sounds like Microsoft hasn’t “baked it in” to all versions of Excel 2010/2013.
Great question Chris! PowerPivot does bring some Access capabilities to Excel. Mostly by allowing you to create relationships between data tables. It also allows you to link the PowerPivot data model to Access or another database.
You are going to experience some limitations when sending files to users that don’t have PowerPivot installed. These users will be able to view the Pivot Tables created with PowerPivot, but they won’t be able to modify them.
With any project, I think it is best to fully map out your process for distributing and publishing reports, then determine if PowerPivot will be the best fit. I’m speaking from experience on this one, as I have honestly made the mistake of using PowerPivot on projects where it made the update and distribution process a little too complicated. However, PowerPivot did allow us to discover new insights about the business that would have been difficult to find otherwise. So, it definitely depends on the scope of you project.
Maybe an easier way to explain it is to think of it like that sports car pictured above. Although it is very fast and powerful, it can’t tackle every single road you throw at it. It’s probably not going to do very well on a bumpy dirt road or a river crossing. So it’s best to plan out your drive to make sure it will be smooth sailing the whole way. You might need to fall back on old faithful sometimes, and it’s good to keep her around. 🙂
Microsoft has designed PowerPivot to integrate with their SharePoint server technology, and these new BI tools work great if your company is running SharePoint 2013. But this is more enterprise level stuff, and not something everyone is going to have access to.
I have also developed an add-in for PowerPivot that helps with exporting reports, to distribute to users that do not have the PowerPivot add-in installed. I will be sharing more on this in the coming months.
With all that said, I still recommend learning PowerPivot. It is definitely the way of the future, and will become easier to implement as the technology evolves and more companies upgrade to the latest versions.
Please let me know if you have any other questions. Thanks!
Thanks for the clarification Jon! Looking forward to seeing what you came up with as an add-in 🙂
I developed an application in excel vba to process large data records creating pivot tables (and vlookup function).
The input data size became big with 400,000+ rows and 10 columns fields. My vba to pivot this data resulted in error that it can’t handle that size.
Can you please help how Power Pivot can help me to resolve this situation and to successfully create pivot table for this size of data and also how it can be included in my vba code for my application run seamless?
I appreciate your help.
Hi Sastry,
Yes, you can definitely use Power Pivot to work with that many rows of data. I don’t have any tutorials on it, but there are a few books on my resources page that will help. If you are looking for a consultant I would be happy to refer you to someone that can help. Thanks!
I am trying to link numerous excel worksheet (tables) into one PowerPivot workbook. The reason is, I want to try to create relationships between these tables and my master data, instead of doing numerous VLOOKUPs.
I’m having trouble linking excel tables from 2 different workbooks into the same PowerPivot workbook. Is this possible? Or do all the excel files in your PowerPivot workbook have to from the same excel workbook?
Hi Laura,
The Tables will have to be in the same workbook. You can bring in data from other workbooks using Power Query.
I hope that helps. Thanks!
Hi Jon,
I am just starting out with power pivots having been an avid user of vlookup for years. I have created 2 tables called A & B , A has many rows of data and B is a small table with the values I would normally do a vlookup into. A has a field called Role and so does B which also has a min and max value for each Role. I have created a relationship between the two tables using Role and now want to create a pivot that shows me for each row in A the Role and the corresponding min and max for that role out of B. If I was using vlookup it would be something like vlookup(TableA_A2,TableB_A2:C30,2,false). When I create the power pivot and use the role from table A and the min from table B it gives me every min value in table B, not just the one for the matching role. What am I doing wrong? I hope I have explained this clearly enough!
Hi Philippa,
Great question! Yes, you explained it clearly. This is due to the way the relationship is setup between the tables. Power Pivot is expecting to work in the opposite way, and do calculations on table A. You can perform calculations on Table B, but you would need a DAX measure for that. I would recommend taking one of the courses or books I have listed on my resources page for Power Pivot. It’s definitely a different way of thinking, and it’s best to get a good understanding of how PowerPivot works. The book by Rob Collie is also a great start. I hope that helps. Thanks!
I’m having the exact same issue and have tried everything to fix but failed. The vlookup works fine so I know the key columns match and are valid. Let me know if you find the solution.
Dear Jon,
thanks for your interesting article. i have 1 problem with power pivot which needs your assistance.
i notice that whenever i upload the excel file size less than 10MBs to data model of power pivot, the size is increased instead of decreased. if the excel file is bigger than 10MBs, data model can reduce size my 2/3 without any problem.
regards,
Muyleng
Jon,
Is there a way to simply use Power Pivot to create an updated worksheet?
For example, using your example. If I get a new Sales Data file and simply want to add the Product and Region data populated in new columns?
In other words, I’d like to use the relational db, but not the pivot table. Is this possible?
Thanks!
Hi Mike,
For this you will probably want to use Power Query. That link explains more about Power Query. It’s a great new tool for getting and transforming data in Excel from all kinds of different sources. I hope that helps.
Thank you Jon, really enjoyed your article.
Quick question, Vlookup with a search function to find a sub string within certain fields in one file, and write a different result in another file.
Basically search for multiple different strings in a row, and write back a yes or no in another file next to the string.
Would this be possible using PowerPivot?
Thank you!
hey ,
I have a file with a lot of formula in it (vlookup with if ..and..or ) very complex Calculated columns , every month I paste a data base in to it and my formula do the work .
my question is how can I match all my complex formulas into the power pivot ?
do I have to figure it out from the start with the dax and match it ? or maybe there is a way to transform the formula so I wont have to built it from the beginning ???
its very important question Because every one have this problem….
TNX michael
How does PowerPivot differ from PivotPal?
Hi Jon, I was excited to start using PowerPivot as most of my spreadsheets come from different applications (SAGE, Timeslips and Quickbase csv files). However, we use Office 365 Excel 2016 and apparently the PowerPivot Add-In is not available without a purchase. I read the forum and blog posts (below) and found out that:
“Small business users—Office 365 small business users who are using one of the Office 365 Business plans for most of their organization can now purchase Office 365 ProPlus for users who need the premium features and leave the rest unchanged.”
https://answers.microsoft.com/en-us/msoffice/forum/msoffice_excel-mso_other/why-is-excel-2016-different-from-excel-2016/fb6abeba-0ed9-41af-8d4c-72efaebaa2d4
https://blogs.office.com/en-us/2015/09/18/new-ways-to-get-the-excel-business-analytics-features-you-need/
You may want to address this when talking about the free add-ins for PowerPivot.
Let me know if you have any suggestions. I’m going to try to install it at home on my 2013 version (my boss won’t put out the $$ to upgrade to the Office 365 ProPlus)
Love your videos, by the way!
Debi Morgan
How do I download Power Pivot?
How do I change my email address?
Dear Jon,
I need your help. I want to learn more on vlookups and pivot table.
Pls let me know how will I start.
Thank you.
Ren
hi. noone mentioning important point here that in pivot row field you can only insert lookup table field which according to me is not a complete solution. What if i like to put foreign key in row field and then see the data. I think, that way you will not get output. i tried it and only solution i can think of is either you use powerquery – merge table option or related function in calculated field of powerpivot. But, how it is replacing the vlookup function because vlookup does not give you numbers , it also returns the text value too in front of the data. in relationships , when you create pivots using powerpivot window, can you do the same?