Bottom line: Learn how to evenly space, align, and distribute shapes, charts, slicers, etc. Includes a manual approach using the Alignment tools built into Excel, and an automated solution using VBA macros.
Skill level: Intermediate
Download the Excel File
Download the Excel file that contains the VBA macro code.
Cascading Shapes & Slicers Aren't Useful
When we insert multiple slicers on a sheet, they are placed in a cascading layout and overlap each other. We also see this layout when we make a duplicate copy of a shape using the Ctrl+D shortcut.
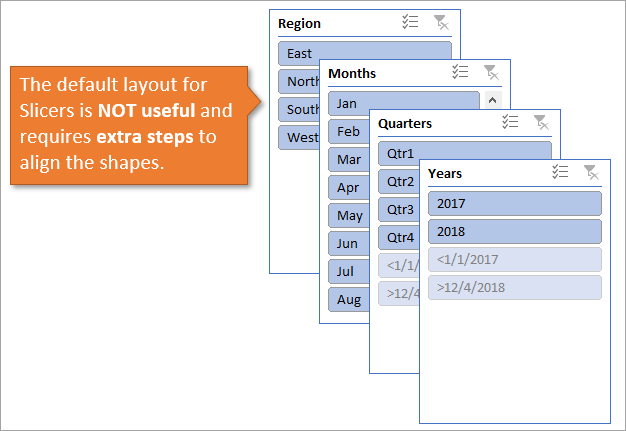
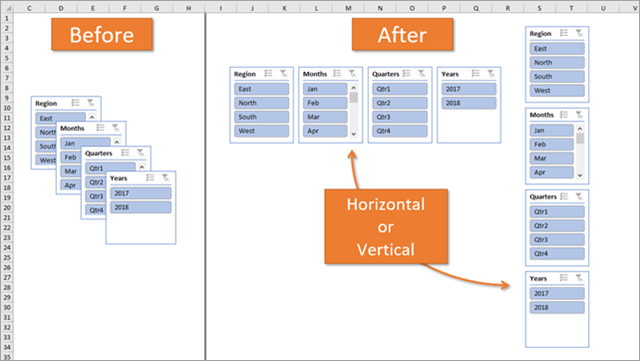
This cascading layout isn't very useful, and we always have to take extra steps to arrange the shapes so they are all visible. We typically want to align the shapes horizontally or vertically, with even space between each shape.
In this article and video above I share techniques for aligning and distributing (even spacing) shapes. We will look at how to do this manually with the Alignment tools built into Excel. I also share a set of macros that automate this process, and can even put our shapes into a grid layout.
What is a Shape?
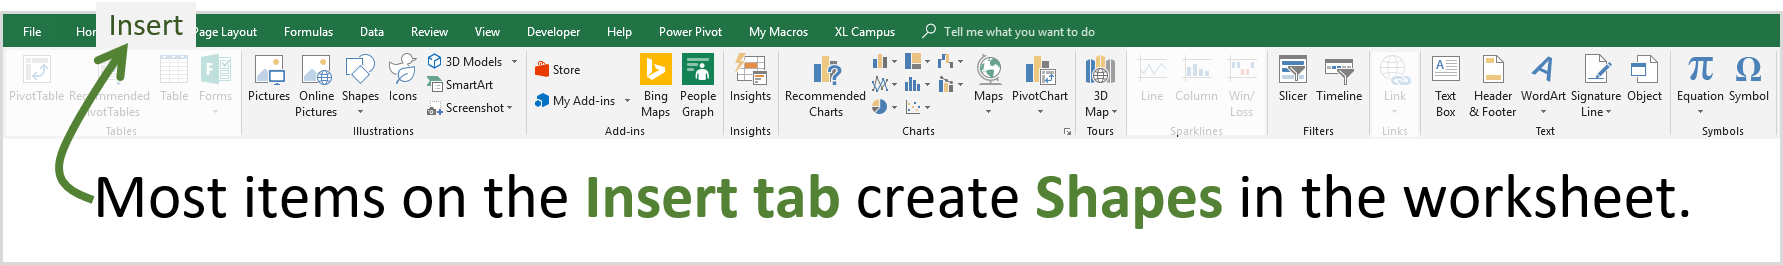
I should also mention that Charts, Slicers, Timelines, Pictures, Images, Icons, 3D Models, SmartArt, Word Art, and Controls (buttons, comboboxes, etc.) are all considered Shapes in Excel. Most of these items are found on the Insert tab of the Ribbon.
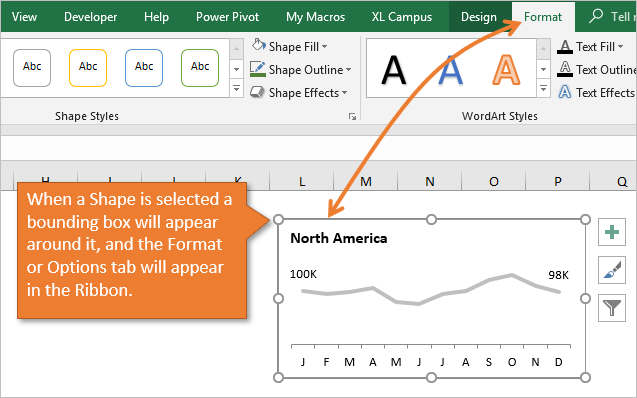
Anything that sits on top of the worksheet (above the cells) and can be moved and resized is a shape. When a shape is selected on the sheet, and bounding box will appear around it and the Format/Options tabs will appear in the Ribbon.
The techniques presented in this article will apply to all types of shape objects.
The Manual Approach with Excel's Alignment Tools
We are first going to look at how to align those cascading slicers using the Alignment tools in Excel. This is a good example because we typically want to align and distribute slicers horizontally or vertically on the sheet, especially when the sheet contains a dashboard.
Again, these techniques will apply to all shapes (charts, slicers, images, controls, etc.).
Step-by-step Guide to Align & Distribute Shapes
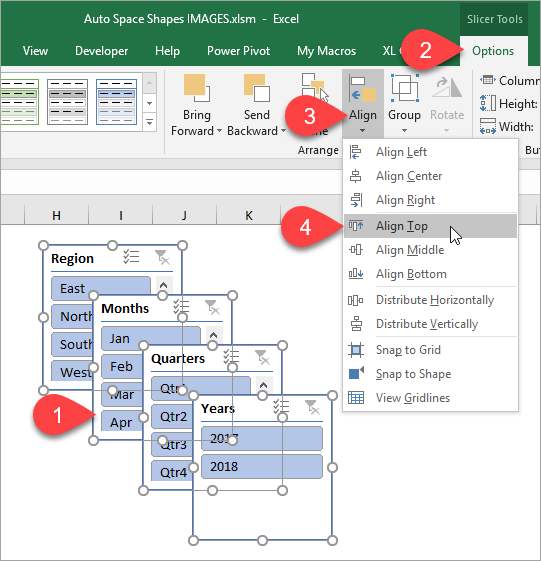
Here are the steps to manually align and distribute the slicers horizontally (the video above also contains these instructions):
- Select all the slicers you want to align. Hold the Ctrl key to select multiple slicers (shapes). Or select one slicer, then press Ctrl+A to select all shapes on the sheet.
- The Options or Format tab will appear in the Ribbon when shapes are selected.
- Press the Align drop-down button in that tab.
- Click the Align Top button. The slicers will all be aligned to the top of the slicer with the highest position on the sheet.

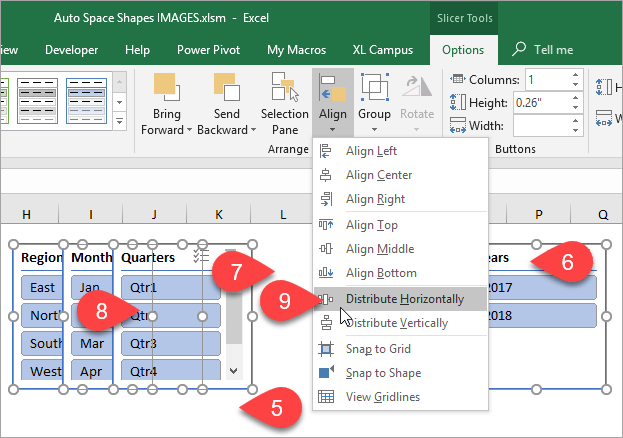
- The slicers will still be overlapped. We need to distribute them evenly. Click a cell in the sheet to deselect the slicers.
- Then select the slicer in the furthest right position. Left click and hold the slicer and move it out to the right. Hold the Shift key to keep the vertical alignment to the other shapes.
- At this point you have to guess how far to the right to move the slicer so all other slicers will fit between the first and last slicer.
- Select all the slicers (shapes) again.
- Click the Distribute Horizontally button from the Align drop-down menu.

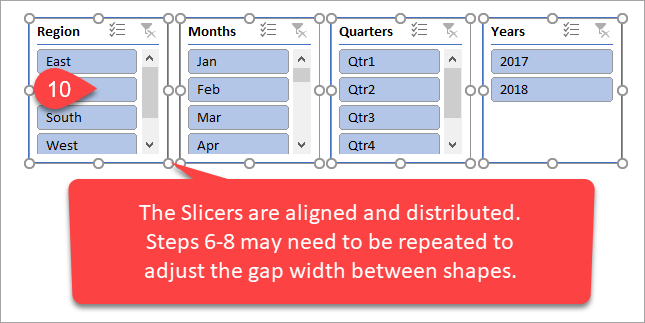
- The slicers will be distributed to create equal space between each slicer. Unless you are really good at guessing, the gap width between each slicer might be too narrow or wide. In this case you have to move the last slicer left/right, then repeat steps 6-8 above.

I do have a few previous articles that cover some other methods for aligning shapes with the tools in Excel.
- How to Copy and Align Charts and Shapes in Excel Dashbords
- Resize & Align Dashboard Elements with Snap to Shape
These methods work well, but do require some trial and error to get the gap width right. There are a lot of steps, and this can take some time to get it perfect.
So I wrote a few macros to make this process much faster and easier!
Automatically Align & Space Shapes Macros
These macros will align and evenly distribute your shapes horizontally or vertically with a click of a button. The gap width is set in the macro code, which means there will be an even space between each shape. So you don't have to worry about any overlap.
One additional benefit of these macros is that you can quickly change the order of the shapes. The layout is based on the order you select the shapes while holding the Ctrl key. More on that below.
Video Explanation of the AutoSpace Shapes Macros
Here is a video where I step through the VBA code and explain how the macro works.
The Macro Code
You can download the file that contains the VBA code in the downloads section above.
Here is the code for the macro that aligns and distributes the shapes with even space vertically.
Sub AutoSpace_Shapes_Vertical()
'Automatically space and align shapes

Dim shp As Shape
Dim lCnt As Long
Dim dTop As Double
Dim dLeft As Double
Dim dHeight As Double
Const dSPACE As Double = 8

  'Check if shapes are selected
  If TypeName(Selection) = "Range" Then
    MsgBox "Please select shapes before running the macro."
    Exit Sub
  End If

  'Set variables
  lCnt = 1

  'Loop through selected shapes (charts, slicers, timelines, etc.)
  For Each shp In Selection.ShapeRange
    With shp
      'If not first shape then move it below previous shape and align left.
      If lCnt > 1 Then
        .Top = dTop + dHeight + dSPACE
        .Left = dLeft
      End If

      'Store properties of shape for use in moving next shape in the collection.
      dTop = .Top
      dLeft = .Left
      dHeight = .Height
    End With

    'Add to shape counter
    lCnt = lCnt + 1

  Next shp

End Sub
Here is the code for the Horizontal layout.
Sub AutoSpace_Shapes_Horizontal()
'Automatically space and align shapes

Dim shp As Shape
Dim lCnt As Long
Dim dTop As Double
Dim dLeft As Double
Dim dWidth As Double
Const dSPACE As Double = 8 'Set space between shapes in points

  'Check if shapes are selected
  If TypeName(Selection) = "Range" Then
    MsgBox "Please select shapes before running the macro."
    Exit Sub
  End If

  'Set variables
  lCnt = 1

  'Loop through selected shapes (charts, slicers, timelines, etc.)
  For Each shp In Selection.ShapeRange
    With shp
      'If not first shape then move to right of previous shape and align top.
      If lCnt > 1 Then
        .Top = dTop
        .Left = dLeft + dWidth + dSPACE
      End If

      'Store properties of shape for use in moving next shape in the collection.
      dTop = .Top
      dLeft = .Left
      dWidth = .Width
    End With

    'Add to shape counter
    lCnt = lCnt + 1
  Next shp

End Sub
How the Macros Work
The macro loops through each shape in the collection of shapes that the user has selected. It starts with the first shape the user selected and uses that as the starting shape. It then moves the next selected shape below (vertical) or to the right (horizontal) of the previous shape in the collection.
The macro does the movement by storing the top & left locations, and the height & width of the previous shape in variables (dTop, dLeft, dHeight, dWidth). The next shape in the loop is then moved by setting the top and left properties based on those variables. A gap width variable (constant) is also used to create space between the shapes. The value of the gap width is in points and can be changed in the macro. See the video above for details.
Change the Order of the Shapes
One additional benefit of this macro is that you can quickly change the order of the shapes. This is based on the order that you select the shapes.
To re-order the shapes:
- Select the shapes in the order you want them displayed (top-to-bottom or left-to-right) by holding the Ctrl key as you select the shapes.
- Run the macro.
The Selection.ShapeRange object returns a collection of shapes in the order they were selected. Since the macro loops through this collection, the shapes will be laid out in the order they are selected.
Add the Macros to Your Personal Macro Workbook
These macros can be added to your Personal Macro Workbook. This allows you to run the macros on any Excel file you have open.
You can also create a custom ribbon with macro buttons that call (run) the macros.
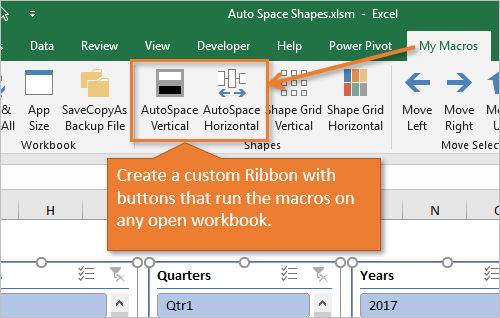
Checkout my 4-part video series on how to create your Personal Macro Workbook. The series includes instructions on how to create the custom ribbon and add macro buttons to it.
Evenly Space Shapes for Better Reports & Dashboards
I hope these tips help you align and distribute your shapes quickly. It can be a time consuming task with some of Excel's alignment tools, but the macros make the process much faster.
If you're new to creating dashboards then checkout by free 3-part video series on Pivot Tables & Dashboards. In video #3 of the series I explain some other techniques for aligning charts and slicers in your dashboards.
Please leave a comment below with any questions or suggestions. Thank you! 🙂


Jon –
You mentioned holding the Shift key while dragging a slicer to constrain it to move horizontally. But there are other ways to constrain movement of shapes while you drag them.
Holding Shift while dragging constrains object motion to horizontal or vertical.
Holding Alt while dragging moves the object to positions aligned with cell boundaries in the underlying worksheet. This is an awesome way to align charts or slicers in a dashboard.
Holding Ctrl while dragging leaves the original object in place and moves a duplicate of that object.
Holding two (or three) of these buttons applies the behaviors of both (or all three) buttons: if you hold Alt+Ctrl, you get a copy of the object which becomes aligned with the grid.
THANK YOU, Jon! Great tips! I forgot to link to my other articles that explain more about these techniques.
How to Copy and Align Charts and Shapes in Excel Dashbords
Resize & Align Dashboard Elements with Snap to Shape
I didn’t know about the Alt+Ctrl shortcut to align to the grid. If you toggle the “Snap to Shape” mode on (explained in the link above), then holding Alt while moving the shape will temporarily turn Snap to Shape off. Snap to Shape isn’t one I use often, but it can be very useful when you are setting up a dashboard that doesn’t align with the grid (cells on sheet).
Thanks again! I still want to know how you’ve cloned yourself to be EVERYWHERE on the web when it comes to Excel charts. 🙂
Thank you for making Excel and life easier!
Thank you Dawn! 🙂
Great tips by both Jons.
Thanks Sandeep!
Elegant solution – thanks for sharing.
Worth noting as well that with multiple shapes/charts selected you can also move them as one group after you have aligned them – using the Alt key to align to the grid if required.
Excellent work Jon! very useful when preparing dashboards.
Thanks a lot for the great time saving tips.
Do you have a topic on powerpoint shapes positioning? Like positioning 35 tables in a slide automatically? Tables are from excel
Very concise and practical article and thank you very much for the macros. That will save me a lot of time!
Hi Any video or file for the “Move Selection” macros?
This thread is a few years old but very useful for my purpose. I’d like to align ONLY slicer shapes. I added “If shp.Type = msoSlicer Then…” above “With shp” in the original code above, but it’s not working. Thoughts?