Bottom line: Learn how to quickly arrange your charts in a panel chart or shape grid layout with a VBA macro in Excel. Applies to all types of shapes including slicers, images, charts, etc.
Skill level: Intermediate
Download the Excel File
Download the Excel file that contains the VBA macro code. The macros are at the bottom of the m_AutoSpace code module in the file.
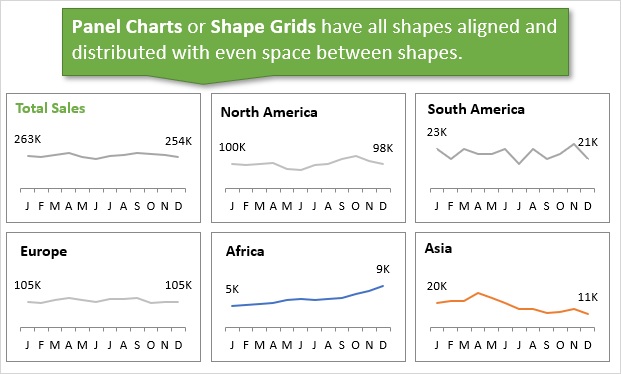
What is a Panel Chart or Shape Grid?
Sometimes we want to have multiple rows or columns of shapes and want to display them in a grid layout. This is especially useful for a collection of small charts that we refer to as a panel chart.
I've covered manual approaches to achieving this layout in past articles.
- 2 Ways to Align & Space Shapes, Charts, or Slicers + VBA Macro
- How to Copy and Align Charts and Shapes in Excel Dashbords
- Resize & Align Dashboard Elements with Snap to Shape
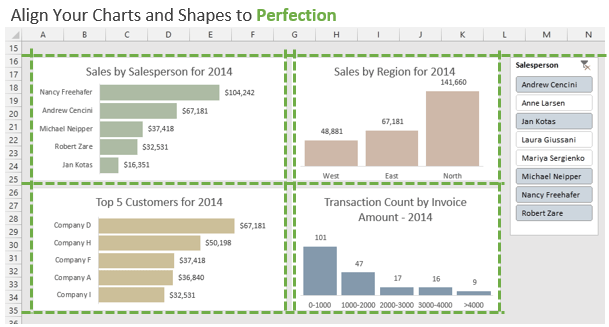
Those articles explain how to use the Alignment tools built into Excel. They are great techniques to know, but also take quite a few steps to achieve the grid layout.
So, I created a few macros that automate this process of creating an evenly spaced shape grid. This is a continuation of my previous post on the Auto Space Macros to create a single column (vertical) or row (horizontal) layout.
The Shape Grid Macro
In the video above I explain how to use the Shape Grid macros to create a grid layout for any type of shape. There are separate macros for a horizontal or vertical layout.
Here are the steps for running the macro.
Step 1: Select Multiple Shapes
The macros run on the shapes you have selected in the worksheet. So the first step before running the macro is to select multiple shapes.
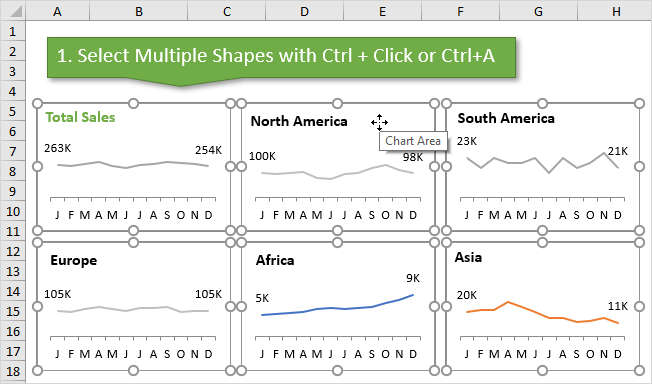
Here are a few ways select multiple shapes:
- Select one shape, then press Ctrl+A to select all shapes on the sheet.
- Select one shape, then hold the Ctrl key and left-click other shapes to select them.
Note: Charts, Slicers, Timelines, Pictures, Images, Icons, 3D Models, SmartArt, Word Art, and Controls (buttons, comboboxes, etc.) are all considered Shapes in Excel. Most of these items are found on the Insert tab of the Ribbon.
Step 2: Specify the Number of Rows or Columns
You can specify the number of rows or columns you want in the grid.

The number of rows or columns in the grid is set with an InputBox. The InputBox will appear when you run the macro, and prompts the user to input the number of rows (horizontal) or columns (vertical).
Step 3: Specify Space Between Shapes
The macros will create an equal space between each shape, and you can control this distance. A second InputBox is used to prompt the user for space (gap width) between each shape.
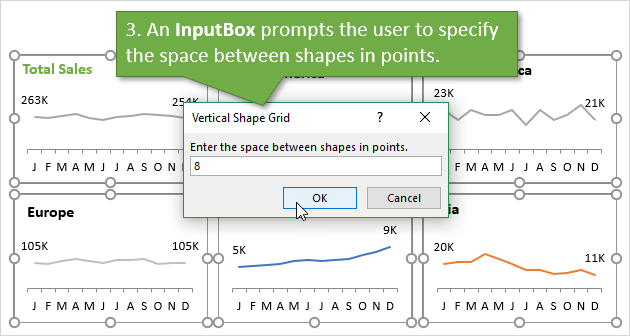
This number is specified in Points. Points are the same measurement you see in the screentip when adjusting Row Heights or Column Widths in the worksheet.
I like to use a gap width of 8. However, you can use any number. Inputting 0 (zero) in the InputBox will create a grid without any space between the shapes.
The Result
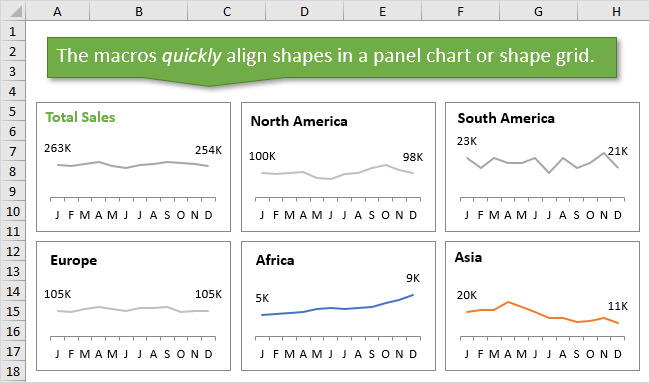
The macro will run and move all selected shapes into a perfectly aligned and evenly distributed grid layout.
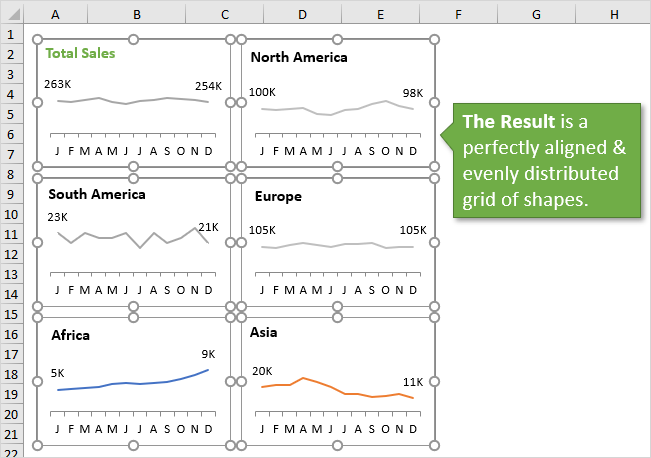
It can all be done with a few clicks, and will save you a ton of time!
How the Macros Work
The Shape Grid macros work similar to the Auto Space macros. Checkout my post and video explanation of the AutoSpace macro for more details.
The macro loops through the collection of selected shapes and moves each shapes below or to the right of the previous shape.
There are a few If statements and a counter variable that determine if the next shape in the loop should be placed in the same row/column or a new row/column.
The shape's Top, Left, Height, and Width properties are used to move the shapes. These properties are stored in variables for the previous shape's location & size. The variables are then used to move the next shape below or to the right.
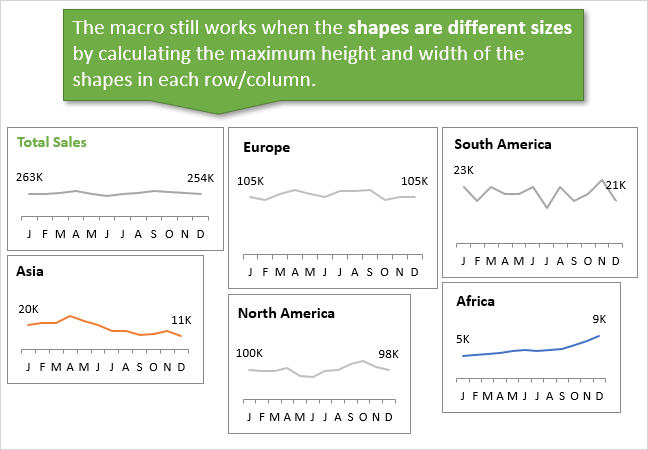
A MaxHeight variable is used to determine the maximum height or width of the shapes in a row or column. This prevents shapes from being overlapped if the shapes are not all the same size.
The Macro Code
You can download the file that contains the VBA code in the downloads section above. The macros are at the bottom of the m_AutoSpace code module in that file.
Here is the code for the macros.
Sub Shape_Grid_Vertical()
'Automatically space and align shapes to create vertical grid.

Dim shp As Shape
Dim lCnt As Long
Dim dTop As Double
Dim dLeft As Double
Dim dHeight As Double
Dim dWidth As Double
Dim dSPACE As Variant
Dim lRowCnt As Variant
Dim dStart As Double
Dim dMaxHeight As Double

  'Check if shapes are selected
  If TypeName(Selection) = "Range" Then
    MsgBox "Please select shapes before running the macro."
    Exit Sub
  End If

  'Display an input box to ask user for the number of columns in the vertical grid.
  lRowCnt = Application.InputBox("Enter the number of columns for the vertical shape grid.", "Vertical Shape Grid", Type:=1)

  'Exit macro if user presses cancel
  If lRowCnt <= 0 Or lRowCnt = False Then
    Exit Sub
  End If

  'Display an input box to ask user for the amount of space between shapes.
  dSPACE = Application.InputBox("Enter the space between shapes in points.", "Vertical Shape Grid", Type:=1)

  'Exit macro if user presses cancel
  If TypeName(dSPACE) = "Boolean" Then
    Exit Sub
  End If

  'Set variables
  lCnt = 1

  'Loop through selected shapes (charts, slicers, timelines, etc.)
  For Each shp In Selection.ShapeRange
    With shp
      'If first shape then store left position
      If lCnt = 1 Then
        dStart = .Left
      Else
        If lCnt Mod lRowCnt = 1 Or lRowCnt = 1 Then
          'New row, move shape down
          .Top = dTop + dMaxHeight + dSPACE
          .Left = dStart
          dMaxHeight = .Height
        Else
          'Same row, move shape right
          .Top = dTop
          .Left = dLeft + dWidth + dSPACE
        End If

      End If

      'Store properties of shape for use in moving next shape in the collection.
      dTop = .Top
      dLeft = .Left
      dHeight = .Height
      dWidth = .Width
      dMaxHeight = WorksheetFunction.Max(dMaxHeight, .Height)
    End With

    'Add to shape counter
    lCnt = lCnt + 1
  Next shp

End Sub
Sub Shape_Grid_Horizontal()
'Automatically space and align shapes to create horizontal grid.

Dim shp As Shape
Dim lCnt As Long
Dim dTop As Double
Dim dLeft As Double
Dim dHeight As Double
Dim dWidth As Double
Dim dSPACE As Variant
Dim lColCnt As Variant
Dim lCol As Long
Dim dStart As Double
Dim lRow As Double
Dim dMaxWidth As Double

  'Check if shapes are selected
  If TypeName(Selection) = "Range" Then
    MsgBox "Please select shapes before running the macro."
    Exit Sub
  End If

  'Display an input box to ask user for the number of rows in the horizontal grid.
  lColCnt = Application.InputBox("Enter the number of rows for the horizontal shape grid.", "Horizontal Shape Grid", Type:=1)

  'Exit macro if user presses cancel
  If lColCnt <= 0 Or lColCnt = False Then
    Exit Sub
  End If

  'Display an input box to ask user for the amount of space between shapes.
  dSPACE = Application.InputBox("Enter the space between shapes in points.", "Horizontal Shape Grid", Type:=1)

  'Exit macro if user presses cancel
  If TypeName(dSPACE) = "Boolean" Then
    Exit Sub
  End If

  'Set variables
  lCnt = 1

  'Loop through selected shapes (charts, slicers, timelines, etc.)
  For Each shp In Selection.ShapeRange
    With shp
      'If first shape then store top position
      If lCnt = 1 Then
        dStart = .Top
      Else
        If lCnt Mod lColCnt = 1 Or lColCnt = 1 Then
          'New column, move shape right
          .Top = dStart
          .Left = dLeft + dMaxWidth + dSPACE
          dMaxWidth = .Width
        Else
          'Same column, move shape down
          .Top = dTop + dHeight + dSPACE
          .Left = dLeft
        End If
      End If

      'Store properties of shape for use in moving next shape in the collection.
      dTop = .Top
      dLeft = .Left
      dHeight = .Height
      dWidth = .Width
      dMaxWidth = WorksheetFunction.Max(dMaxWidth, .Width)
    End With

    'Add to shape counter
    lCnt = lCnt + 1
  Next shp

End Sub
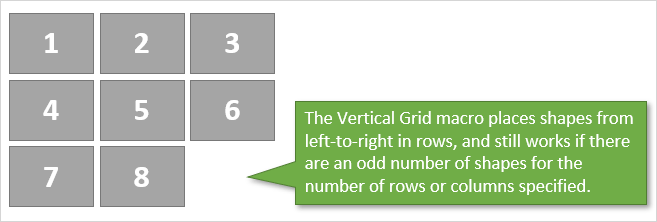
What happens if you have an odd number of shapes?
If you have an odd number of shapes for the number of rows/columns specified, then they will just spill into the next row/column. For example, if you run the Vertical Grid macro for 3 columns and have 8 shapes selected, the last two shapes will be placed in the third row starting from left to right.
Select the Order of the Shapes
One side benefit of using this For Next Loop to loop through all selected shapes (Selection.ShapeRange), is that we can easily re-order the shapes in the grid.
The ShapeRange object is a collection of the selected shapes. The loop will loop through the shapes in the order they are selected. So, we can use the Ctrl key to select the shapes in the order we want them displayed, and then run the macro to create the grid.
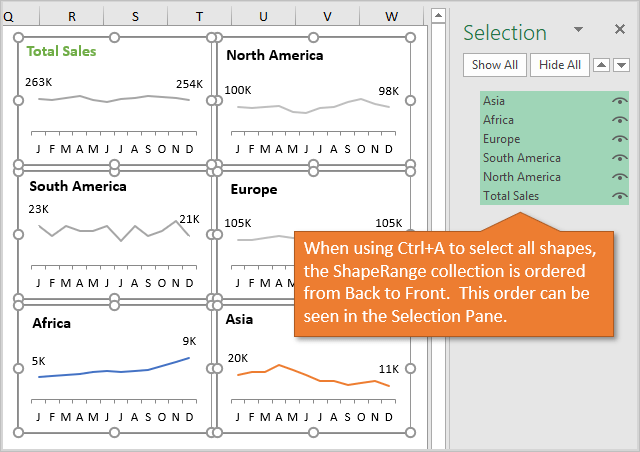
If you use Ctrl+A to select all shapes, then the order of the ShapeRange object is from Back to Front. We can see this in the Selection pane (Home tab > Find & Select button > Selection pane…). Running the macro after pressing Ctrl+A will put the shapes in that order.
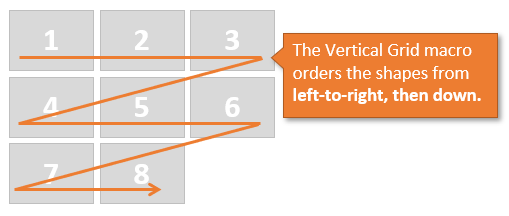
The order for the Vertical Grid is left-to-right, then down to a new row.
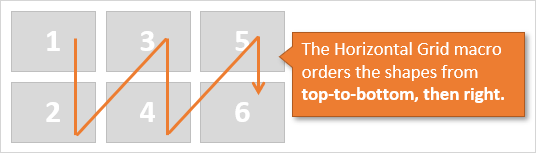
The order for the Horizontal Grid is top-to-bottom, then right to a new column.
This order is a result of the way the macro loops through the shapes. If the order is not what you'd expect, you can run the other macro and change the number of rows/columns. For example, if you run the Horizontal macro with 3 columns and the order isn't right, then try the Vertical macro with 2 columns. That assumes you have 6 shapes. You will have to adjust the number of rows/columns to achieve the right order.
Add the Macros to Your Personal Macro Workbook
These macros can be added to your Personal Macro Workbook. This allows you to run the macros on any Excel file you have open.
You can also create a custom ribbon with macro buttons that call (run) the macros.

Checkout my 4-part video series on how to create your Personal Macro Workbook. The series includes instructions on how to create the custom ribbon and add macro buttons to it.
Create Evenly Spaced Shape Grids with Ease
The Shape Grid macros will quickly align your charts, slicers, and any other shape. This creates a nice grid of evenly spaced shapes. This will work great for setting up dashboards and panel charts.
If you're new to creating dashboards then checkout by free 3-part video series on Pivot Tables & Dashboards. In video #3 of the series I explain some other techniques for aligning charts and slicers in your dashboards.
If you have other uses for this besides charts, then please let us know in the comments below. I'd love to know how you are using it. You can also leave a comment below with any questions or suggestions. Thank you! 🙂


Excellent tip Jon!
I enjoy your expertise. I am always looking to improve my skills in Excel. Thanks Jon for your help!
Thanks for the nice feedback Holly! Happy to hear you are learning more about Excel. 🙂
Thanks Chuck! 🙂
This is fantastic Jon, I only regret why i couldnt joined and subscribed sooner. Lucky me now 🙂
Thanks so much Kate! I really appreciate your support and am happy to have you joining us. 🙂
Brillant work Jon! This functionality was on my “to do” list….now I don’t have to figure it out!
Awesome! Thanks so much Chris! I’m sure you’ll find some ways to modify it or apply to PowerPoint. 🙂
Fantastic, thank you Jon
Thanks Del! 🙂
I have some time now and I like to learn how to use and navigate excel applications like pivoting V-look ups and charting as I look to more valuable Excel trends
Excellent, saves a lot of time.
This is awesome, thank you so much for sharing!
Thanks Thiago!
Hi Jon, I have just discovered this website, and the content is fantastic. I consider(ed) myself an advanced excel user, but I have learnt so much in such a short space of time. Would you be able to share the customer ribbon icons and how you set them up, please?