Bottom Line: Learn what Power BI is and the major differences and similarities between Power BI and Excel.
Skill Level: Beginner
Watch the Tutorial
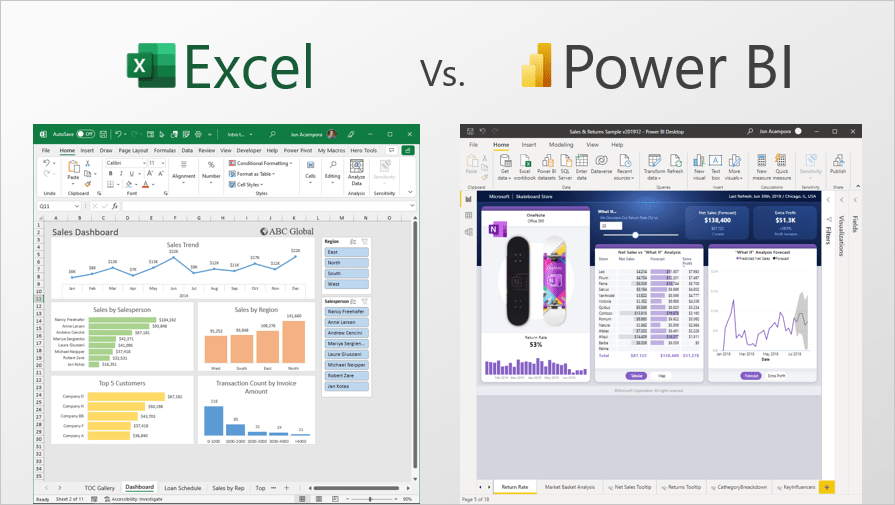
Power BI or Excel?
Are there advantages to using Power BI over Excel—or vice versa? Let's take a high-level look at what these tools are when to use them, and the advantages of using them together.
What is Power BI?
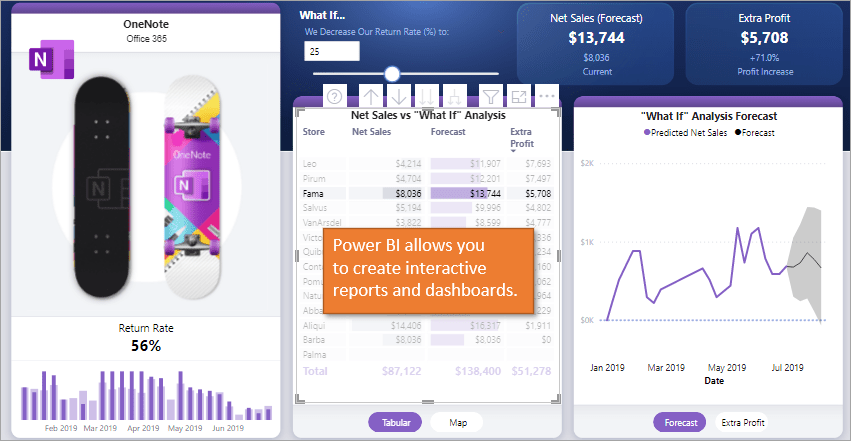
The “BI” in Power BI stands for Business Intelligence; it's software that makes reporting easier and more visually appealing. This platform is awesome for creating interactive dashboards that users can easily share.
As you know, Excel is a spreadsheet application that can do just about ANYTHING (including interactive dashboards). But that doesn't mean there aren't advantages to using Power BI, especially in conjunction with Excel. Let's take a look at some of the advantages and disadvantages of each application.
Power BI Desktop App
Power BI has two major components, the Desktop App and Online Service.
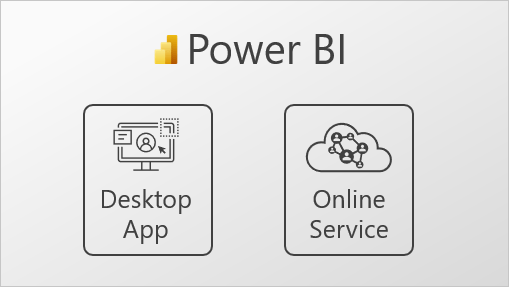
The Desktop App
The first component is the desktop app that you install separately on your computer. Within the desktop app, you use Power Query to retrieve data from any source.
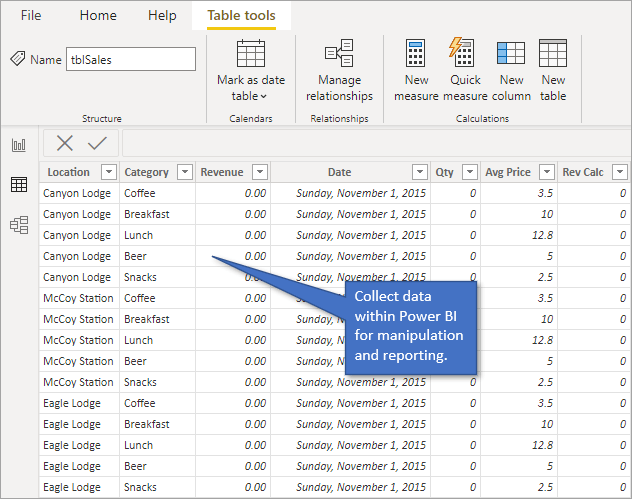
Then you use Power Pivot to create joins and write DAX measures or formulas. (DAX stands for Data Analysis Expressions, a type of programming language.)
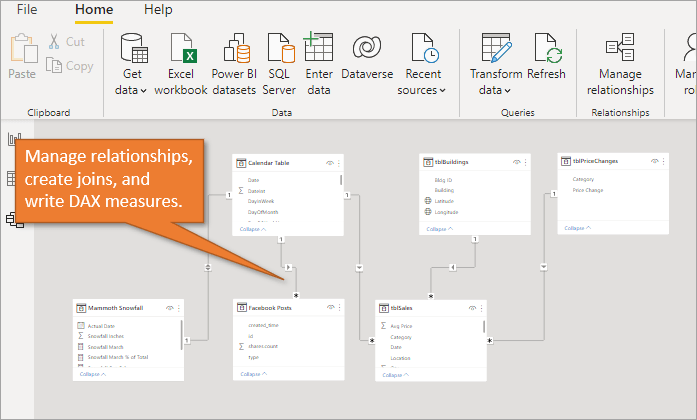
From there you can use visualization tools to create reports and dashboards.
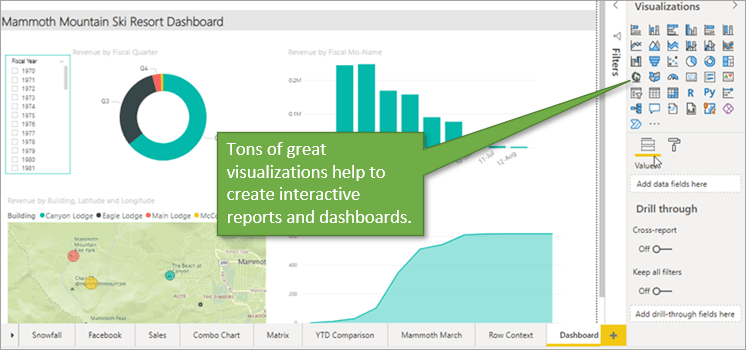
Power BI has the ability to get pretty fancy in its reports and dashboards, making Excel look limited in terms of style and design options.
Power BI Online App
The second component of Power BI is the online app/service. Using this service, you can upload your reports to the web or local server to easily share them with your team so that they can interact with them.
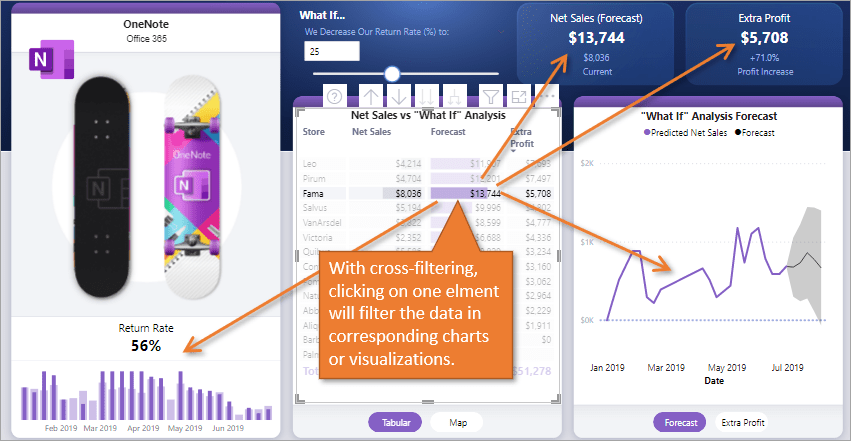
One of the best features of Power BI is its interaction capabilities. One such capability is called cross-filtering. This allows you to click on any element of any chart, and that will filter down corresponding information in the other visualizations on your report/dashboard.
Another great feature is that you can invite users to consume the visualizations on mobile platforms, iOS, and Android devices, or even a smartwatch.
There is also a feature that allows you to create more simplified visualizations for easier navigation and reviewing.
And another benefit of Power BI is that you can apply row-level security. That way, users only have access to the specific data they need. You can also schedule refreshes of your data to happen automatically on a daily or weekly basis.
One great advantage that the online Power BI service has over Excel is that it prevents out-of-date data from being shared via email, etc. That's because everyone is always looking at the most up-to-date version of the reports/dashboards.

What About Excel?
Excel also gives you the ability to create dashboards that are interactive, using slicers and tables. Admittedly, it might not look as sleek as Power BI and it does lack some of the cross-filter capabilities. But the major advantage of Excel is that it can do so much more than create reports.
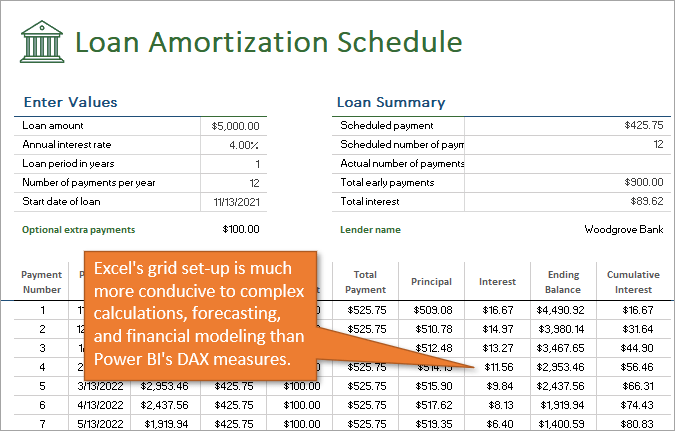
As just one example, you can create a loan schedule with a flexible grid that allows you to insert inputs and have complicated calculations as outputs. That means Excel is much more useful for financial modeling and forecasting.
If you are emailing Excel files to your teammates, there is a risk of sharing outdated information. But that can be avoided with shared platforms such as OneDrive, SharePoint, or Microsoft Teams.
Similarities Between Power BI and Excel
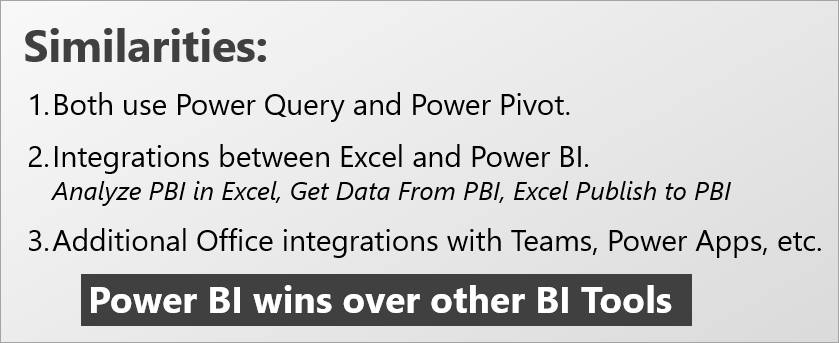
Both Excel and Power BI use Power Query and Power Pivot. So if you've learned either of those skills in Excel, they will help you understand and use Power BI better.
These two systems both integrate really well because they are both created by Microsoft. So if you've created a data model in Excel, and want to publish it in Power BI, the transition will be seamless.
In addition, both Excel and Power BI integrate really well with other Office applications, such as Teams and Power apps, which will help you to save time and automate processes.
Because of these integrations and the fact that you probably already have some experience with Microsoft Office tools, I think Power BI is superior to other Business Intelligence options out there.
So, Which Is Better?
The great thing about this comparison is that you really don't have to choose one over the other. Excel and Power BI work really well in tandem, especially if you are using Excel for the data crunching and Power BI for the presentation and sharing.
As an Excel guy, of course, I'm a big advocate for all that Excel can do, but I wouldn't hesitate to use Power BI to soup up some of my reports and dashboards as needed.
If you'd like to learn more about how to use Power BI, I invite you to take my online course, Power BI: Dashboards & Data.
I hope this post has been helpful for you. Please leave a comment if you have any questions or suggestions.


Jon, Yes, this has been awesome information. I like your spin on the BI and the ability to bring both worlds together. I have often been asked this question (What is the difference between the two?) and I could not answer. Now I can. thank you!!
Awesome! I’m happy to hear it helped, and that you can teach others about Power BI. Thank you for the feedback and have a great weekend, Tony! 🙂
I have loved BI since it burst onto the scene a few years ago, BUT…
The data I work with in the cloud is not allowed to be accessed by Database Connections and ODBC. Therefore, I cannot use desktop tools what connect to the database at all. I believe this is a common situation for applications and data hosted in the cloud. (Mine is Kronos Timekeeper time and attendance software.)
Great point, Kim! I know Microsoft is continuing to add new data connections and also work on ways to connect to those cloud sources, but it can be frustrating when a connection is not possible.
Send notifications on Excel & Power BI
Great post! I appreciate the clear distinctions you made between Excel and Power BI. It’s helpful to understand when to use each tool, especially for different data analysis needs. Looking forward to more insights!
Great insights on the differences between Excel and Power BI! I’ve always used Excel for data analysis, but I can see how Power BI could enhance my visualizations and reporting. Looking forward to integrating Power BI into my workflow. Thanks for the detailed breakdown!
Great breakdown of the differences between Excel and Power BI! I appreciate how you highlighted the strengths of each tool. It’s helped me understand when to use one over the other for my data analysis projects. Thanks for sharing!
Great breakdown of the differences between Excel and Power BI! I always struggled with which tool to use for data analysis, but this post really clarified their strengths. I’m particularly interested in how Power BI can enhance visualizations compared to Excel. Thanks for sharing!
Great breakdown of the differences between Excel and Power BI! I’ve always used Excel for data analysis, but after reading this, I see how Power BI could really enhance my reporting capabilities. Looking forward to diving deeper into Power BI!
Great insights! I’ve always used Excel for data analysis, but Power BI seems like a game changer for visualizations. I appreciate the clear differentiation between the two tools. It’s helping me decide which one to focus on for my projects. Thanks for sharing!
Great breakdown of the differences between Excel and Power BI! I never realized how complementary they can be for data analysis and visualization. Your examples clarified when to use each tool effectively. Thanks for the insights!
Great comparison! I love how you highlighted the strengths of both Excel and Power BI. It’s clear that while Excel is fantastic for detailed data analysis, Power BI shines when it comes to visualization and sharing insights. This post helped me decide which tool to use for my next project. Thanks!
Great breakdown of the differences between Excel and Power BI! I really appreciate how you highlighted the strengths of each tool. It’s helpful to understand when to use one over the other in my data analysis work. Looking forward to more insights like this!
Great post! I found the comparison between Excel and Power BI very insightful. It’s interesting to see how each tool serves different needs depending on the complexity of the data analysis. I’ve always used Excel for reporting, but I’m considering making the switch to Power BI for more interactive visualizations. Thanks for highlighting the strengths of each!
Great insights! I’ve always been curious about the differences between Excel and Power BI. Your explanation really clarified when to use each tool. I appreciate the practical examples you provided. Looking forward to more posts like this!
Great post! I appreciated the clear breakdown of the differences between Excel and Power BI. It’s interesting to see how each tool can complement the other depending on the project requirements. I especially found the use cases you mentioned very helpful in deciding which tool to use for specific tasks. Thanks for sharing!
Great breakdown of the differences between Excel and Power BI! I appreciate how you highlighted the strengths of each tool. It’s clear that while Excel is fantastic for detailed data analysis and manipulation, Power BI really shines when it comes to visualizations and sharing insights. This helps a lot in deciding which tool to use for different tasks!
Great breakdown of the differences! I love how Excel is so flexible for quick analyses while Power BI really shines with its data visualization capabilities. Definitely helps in choosing the right tool for the job!
Great post! I really appreciate how you broke down the key differences between Excel and Power BI. It’s clear that while Excel is powerful for data analysis, Power BI offers more robust visualization capabilities that can enhance reporting. This has helped me understand which tool to use for specific tasks. Thanks for the insights!
Great post! I often find myself torn between using Excel and Power BI for data analysis. Your breakdown of the differences really clarified when to use each tool effectively. I appreciate the examples you provided—they really helped illustrate the points. Keep up the fantastic work!