The Pivot Ready Course
The Step-by-Step System for Learning
How to Master Pivot Tables in Excel
The Pivot Ready Course is an online course that will teach you how to master one of the most powerful tools in Excel, pivot tables.
I have helped teach millions of Excel users about pivot tables through my blog posts and videos. Often times people say,
"It looks so easy when I see someone else do it, but I struggle to build a pivot table with my own data."
If that sounds like you, don't worry, you are not alone. I have found that there are a few major hurdles with learning pivot tables that keep us stuck.
So, I have designed the The Pivot Ready Course to get you unstuck. This course uses my simple step-by-step training system to help you learn pivot tables quickly.
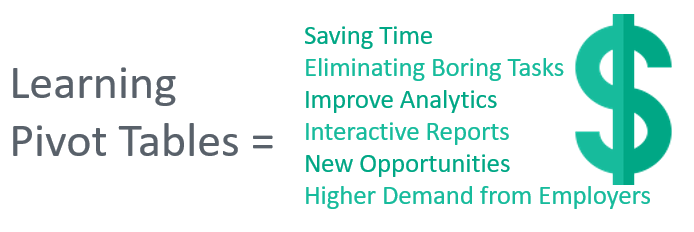
Why Learn Pivot Tables?
One of the most common challenges we face in Excel is making sense of data.
This usually means taking a large amount of data and turning it into summary report that is easy to read and understand. We need to provide reports to management that help analyze trends and gain insights about the business.
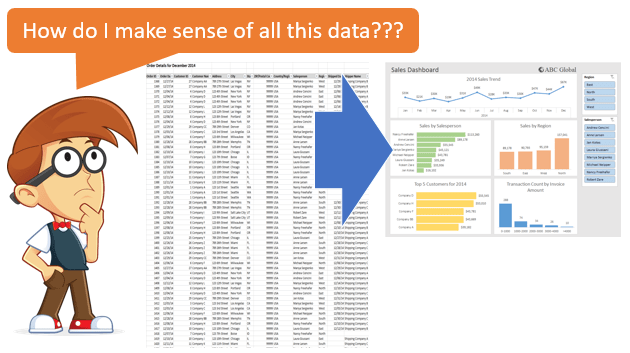
In my opinion, pivot tables are the best tool in Excel for this task. They allow us to take a large amount of data, and quickly turn it into a summary report.
We can use pivot tables to save a TON of time with analyzing data, generating reports, and creating dashboards for senior management. Tasks that would normally take hours or days to complete with complex formulas, can be done with just a few clicks using a pivot table.
In the screencast below I create an interactive report in 30 seconds using a pivot table and pivot chart.
There's no doubt that pivot tables are an amazingly powerful tool that can save us time with our job.
But, why can it feel so challenging to build pivot tables with our own data?
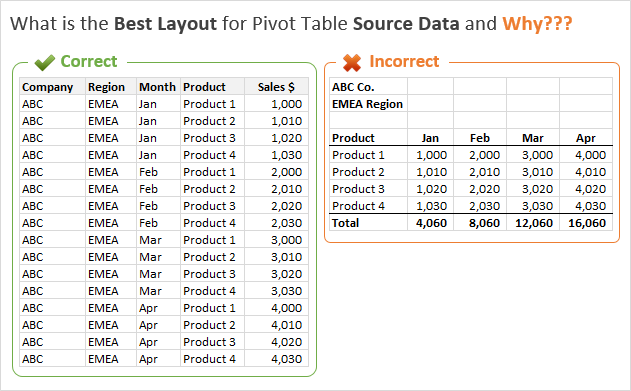
The key to using pivot tables is getting the
source data in the correct layout.
The key to using pivot tables is getting the source data in the correct layout/format. This is the most common mistake I see with pivot tables, and also the biggest point of frustration.
We can waste time dragging fields in the the different areas, not sure of what the results will be. This leaves us guessing, and doing a lot of trial and error to get the desired results.
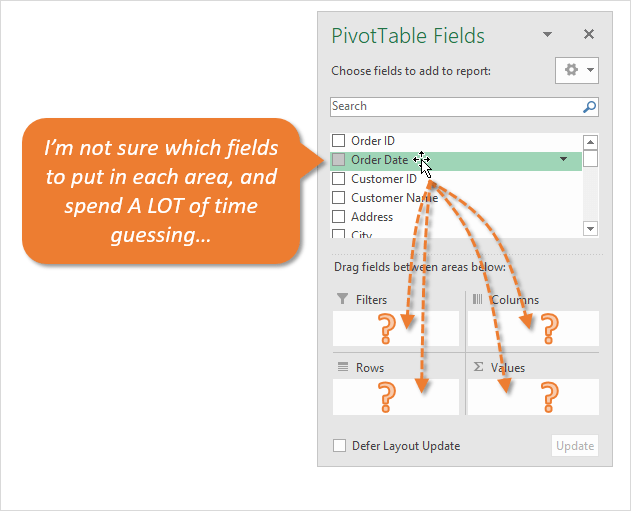
This was my story too. When I first started with pivot tables, I didn't fully understand how they worked. I knew they were powerful and could save time, but there was a lot of guesswork.
My results weren't always consistent, and I wasn't sure why...?
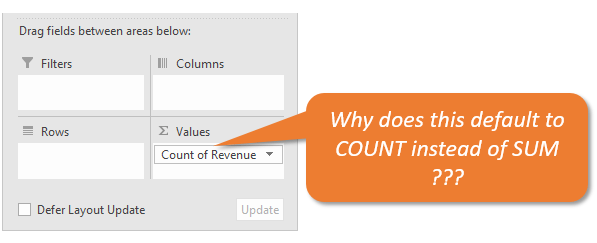
Sometimes the Values area would default to Count instead of Sum. Sometimes the dates wouldn't group into months and years. And I wasn't always sure which areas to drag the fields into.
What I eventually realized is that it is all about the source data.
The source data must be in the correct layout for a pivot table to work properly. This is like putting the wrong type of gas in your car. What will happen if you put diesel fuel in a car that takes regular unleaded gas. I'm not sure, but I don't want to find out... 🙂
So, getting the source data right is critical to making everything else work.
Over the last 10 years I have learned a lot about pivot tables. They have helped me analyze data in new ways. This has not only helped save time, but also made me a valuable resource to my employers. I am able to create interactive reports and dashboards that senior management relies on to make decisions.
This responsibility also gave me more freedom. Instead of being stuck doing the same old boring task, I had more time to work on fun and creative projects that had a greater impact on the organization.
So, I've created The Pivot Ready Course to help teach you these valuable skills.
Who Is This Course For?
The Pivot Ready Course will take you from complete beginner to a pivot tables expert. I use my simple step-by-step learning system to help you gain a true understanding of how pivot tables work.
This course will make you Pivot Ready.
Being Pivot Ready means being able to visualize the results of your pivot table and reverse engineer it so you can get the source data in the correct layout. This will help you get your job done faster with less frustration.
This course is for you if you answer YES to any of the following questions:
- Do you use Excel frequently in an accounting, finance, engineering, marketing, HR, or analyst role?
- Do you work with data sets and reports that are exported from various systems of record (General Ledgers, CRM, ERP, databases)?
- Are you stuck trying to figure out how to summarize the data to create reports and analyze trends?
- Have you heard of pivot tables, but not fully sure how they will benefit you or how to use them properly?
- Do you want to build useful reports and dashboards that your boss and upper management will love?
- Do you want to simplify your reporting processes to save tons of time with your work to free yourself up for bigger projects and opportunities?
This course is designed to equip you with the skills to quickly transform data sets and create amazing reports & analysis.
What Others Are
Saying About Our Training

I've been putting off learning about pivot tables and playing around on my own, a lot of wasted time.... These are great tutorials and well thought out and presented. I'm going recommend to my staff that they take up some time to watch these.
Your lessons are very simple and interesting. It's very easy to understand and the pace is great for explanation. Great help. Thanks a lot !
Well, I am quite impressed by Jon's videos. I am much older than the majority of people who are watching these and a LOT less computer savvy, so I can say that, if I can learn how to manipulate these Excel files into a nice and easy-to-read data format, then anyone can.
I've been using Excel for 18 years, some of which I've taught classes on how to use the application, and I start a job this coming week that will need me to have this skill. In all the years I've worked with Excel I've done much of this manually with formulas and built the charts from scratch. Thank you so much for making these videos. You saved me :)
You made learning how to use pivot tables a breeze! You go through the steps at a reasonable pace, and your instructions are very clear and concise. I can use pivot tables in my day-to-day use of excel. I'll be able to get my work done a lot quicker. Thanks Jon.
Really well done. Thank you. I've not heard about pivot tables or charts until I applied for a job. I'm familiar with Excel, but that threw me. Now I feel very confident using this tool and see that you're going to be a go-to resource for my continued learning. Thank you.
Many thanks for explaining Pivot Tables. Not at all as hard as I thought it would be. Feeling much better & confident for my job interview tomorrow. Wish me luck!
What is an Online Video Course?
The Pivot Ready Course is an online video course. This means you can watch the screencast videos any time you want, in the comfort of your own home or office.
- The course is is divided into 8 training modules.
- Each of these modules is comprised of 8-10 video lessons.
- Each video lesson contains a short 5-10 minute video that helps you build your knowledge and skills.
- You get 24/7 access to watch and re-watch the videos from work, home, tablet, and smartphone. Videos can also be downloaded to watch offline.
Step-by-Step Learning Keeps You On Track
Pivot Tables have a lot of components and features. Learning all of this can feel overwhelming. So I have broke down the video lessons into small bite-sized chunks.
The short videos also make it easy to come back and re-watch a video on a specific topic to get a refresher. Plus, the course site tracks your progress to keep you organized. You will know right where you left the course next time you login.
The lessons come with before & after companion Excel files so you can follow along with the videos and practice the techniques. This type of hands-on learning helps build your skills quickly and apply this knowledge to your own projects.
What Am I Going to Learn?
Here is a detailed list of
The 8 Training Modules
Modules 1: How Pivot Tables Work
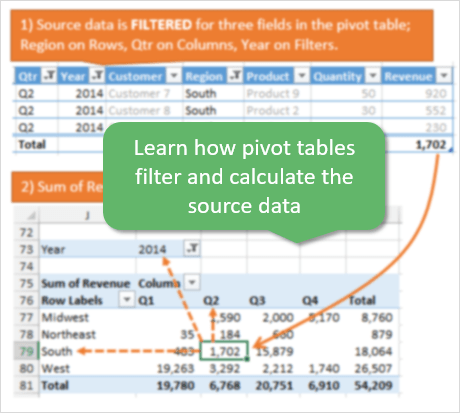
In Module 1 we look at how pivot tables work. You will learn:
- How pivot tables can quickly summarize large data sets to create reports & charts.
- Why the layout of the source data is the most important step in creating pivot tables.
- How the pivot tables filter and calculate data when we add fields to the different pivot table areas.
Module 2: Source Data Basics
Getting the source data in the right layout/format is absolutely critical for building pivot tables.
In Module 2 you will learn some of the basics to preparing your data. This includes: getting the data in a tabular format, deleting or handling blanks, converting text to numbers or dates, and using Excel Tables.
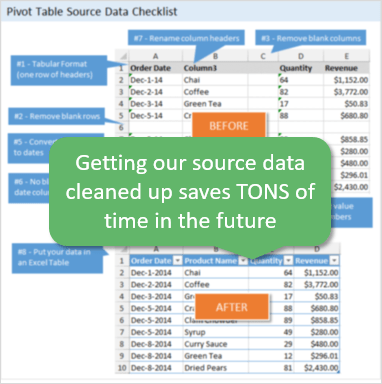
These steps will become your checklist for preparing any data set for use with a pivot table. Doing the prep work up front saves a TON of time and makes pivot tables much easier to work with.
Modules 3: Pivot Table Basics
In Module 3 you will learn how to insert and build pivot tables. This includes tips and shortcuts for creating pivot tables.
We also learn about the Pivot Table Field List. The Field List is the control panel for the pivot table where we drag-and-drop fields to build the reports.
You will learn about each Area of the pivot table, and how we can use them to quickly change the layout of our reports.
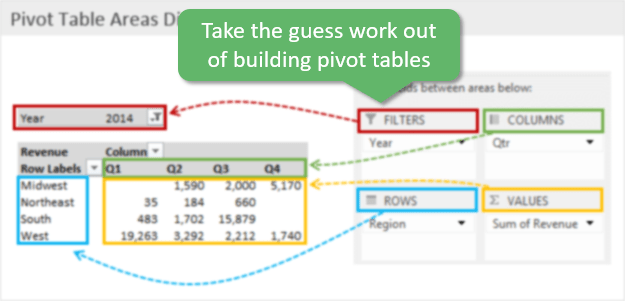
This will help you take the guess work out of it. No more trial and error with dragging and dropping fields into different areas. You will be able to visualize what the pivot table will look like before building it out.
Module 4: Formatting, Layout & Calculations
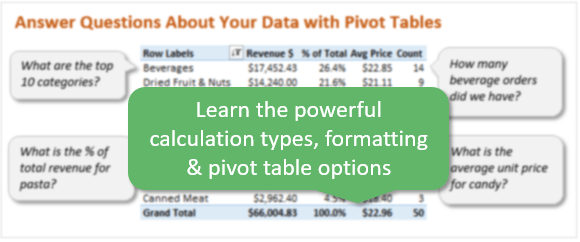
Formatting our reports to meet the boss's expectations is probably one of the most important parts of the job. In Module 4 you will learn:
- How to apply number formatting to make your pivot tables look good.
- The 3 different report layouts for pivot tables.
- How to style the pivot table with different fill and border colors.
- The pivot table options menu that contains 30+ settings, and which ones are important.
- How to change the calculation type of create percentage of total metrics in your pivot tables.
Modules 5: Transforming Source Data with Power Query
Often times our source data is not in the right layout for a pivot table. If the source data isn't right, then the pivot table won't work the way we expect it to.
In Module 5 you will learn how to transform your data into the right layout using Power Query . This is referred to as Unpivoting or Normalizing a data set.
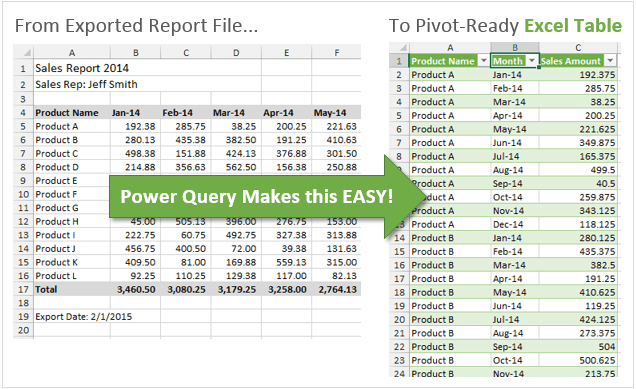
Power Query (now called Get & Transform in Excel 2016) is a great new data transformation tool that makes this process easy. It is available for Excel for Windows for versions 2010 and beyond. In this module I give an overview of how Power Query works, and then explain how to use it to transform our data with a series of step-by-step videos.
We look at how to Unpivot or Normalize different types of reports such as Actual vs Budget reports and inventory reports. We prepare the data for use in pivot table so we can easily create flexible pivot table reports.
Module 6: Adding More Data
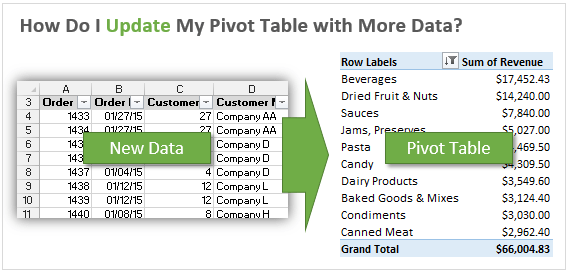
In Module 6 you will learn how to add more data to your source range, and how to refresh the pivot tables.
I explain why using Excel Tables are critical for this process. They not only make it easier to add new data, but also help prevent a lot of errors. This module will help you create systems for updating your reports with new data on a periodic basis.
Getting the Tables and pivot tables setup properly in the beginning can save hours of work and frustration in the future when we need to add new data to our pivot tables.
Module 7: Grouping Date Fields

Typically our source data has columns that contains dates. We might want to create a pivot table report that groups those dates by year, quarter, month, week, etc.
There are two main ways to group dates with Pivot Tables.
- Pivot Tables have a built-in Group Fields feature that can quickly group date fields.
- We can add columns to our source data that contains formulas to create groups.
In Module 7 you will learn both of these methods, and the pros and cons for each method. You will also learn how to group dates for fiscal calendars.
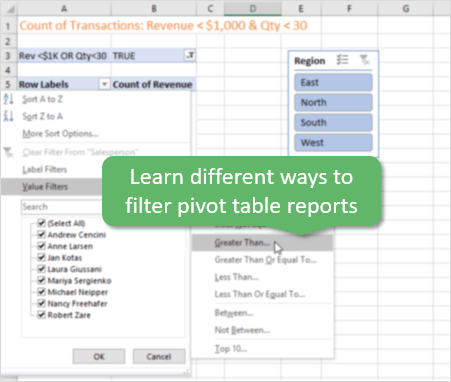
Module 8: Pivot Table Filtering Techniques
In Module 8 you will learn time saving techniques for filtering your pivot tables. This includes:
- How to apply filters to the different areas of the pivot table.
- Creating filters that automatically filter for the current time period (week, month, year, etc.).
- Creating filters for multiple criteria on the values area using AND and OR logic.
For example, how to apply a filter to only include transactions with revenue greater than $1,000 and quantity less than 30.
Some Awesome *Bonuses*
Just For You!
Bonus #1: Excel Companion Files
Along with the videos you are also getting the Excel files I use throughout the course.
You get the BEFORE and AFTER files, so you can follow along with the videos and practice the techniques. This type of hands-on learning will help you improve your skills quickly.
Bonus #2: The Best Course Software
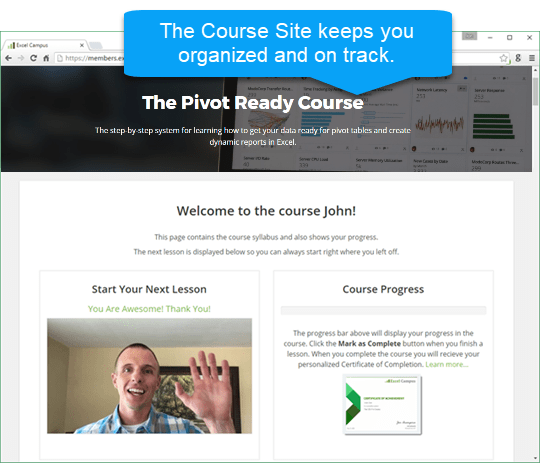
The course site is very easy to use. It tracks your progress for you, allowing you to come back right where you left off. This keeps you organized and helps you focus your time on learning.
You can access the course anytime, from any device. Watch the videos on any tablet or smartphone.
Bonus #3: Comments Section on Every Lesson Page

Each page in the course has a comments section. You can ask questions here and also see what other students in the community are asking. I will be here answering your questions and helping you along the way.
Bonus #4: Certificate of Achievement

You will be emailed this awesome Certificate of Achievement when you complete the course. You can automatically post it to your LinkedIn profile, share it on social media, add it to your resume, and print & frame it.
This will help you market your new skills and let employers know that you are a certified Excel Superstar!
Bonus #5: Module on Slicer Hacks
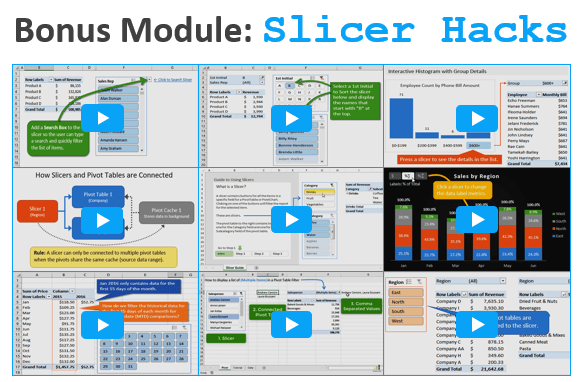
Slicers are an awesome tool that allow us to make our pivot tables and charts interactive. Users love this feature.
In this bonus module I share creative solutions for various ways to use slicers. This includes techniques like: adding a search box to a slicer, filtering/sorting a slicer with a slicer, dynamic chart labels, MTD comparisons, and much more.
These techniques will help bring life to your workbooks and make them easier to use.
Bonus #6: Mini-Course on
Combing Worksheets & Workbooks with Power Query
Sometimes we have source data in multiple worksheets or workbooks. It can be challenging and time consuming to combine the data for use with a pivot table.
Power Query (Get & Transform) makes this process much easier. In this bonus module you will learn how to combine data from multiple worksheets or workbooks.
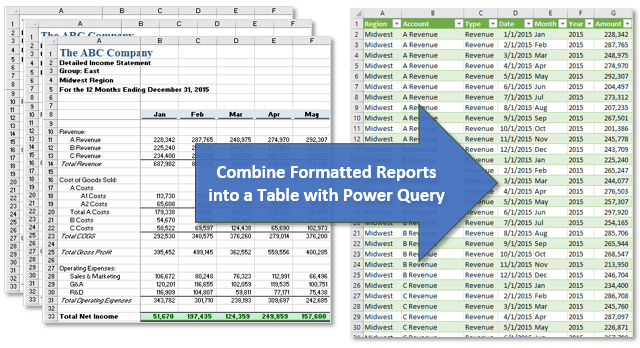
We look at multiple examples of how to clean up and transform the data, then combine (append) it into one large table. If you have formatted reports that look like the example above then this training will save you a TON of time!
Power Query allows us to setup automated systems for cleaning up, transforming, and combining the data. New worksheets or workbooks can automatically be added to the output Table when new data is published every period.
The Combine Data with Power Query Course ($49 value) is included as a free bonus with your enrollment. The course includes 9 tutorial videos that will teach you how simplify this process and prepare your data for use with pivot tables.
Your Instructor

Jon Acampora

Hi, my name is Jon Acampora and I am your instructor for this course.
I have been using Excel for over 10 years as financial analyst and systems developer. Over that time I have become passionate about learning Excel, and finding the fastest and most efficient ways to accomplish a task.
My interests with Excel cover a broad range of topics from data visualization to application development. I have developed dozens (if not hundreds) of VBA applications and add-ins.
I have been awarded the Microsoft MVP Award for my contributions to the Excel community and helping others learn.
More than anything, I really enjoy teaching you these skills and techniques to help you work efficiently and get your job done faster! I am always happy to help answer questions, and I'm here to support you on your journey to learn Excel (and impress your boss). 🙂
How Much Does The Course Cost?
Right now I'm offering lifetime access to The Pivot Ready Course for $297.
I love online video courses because they allow me to provide you with training at a much lower price than live in-person seminars.
A 3-day seminar can run well over $3,000, not to mention travel costs and the fact that you typically have to sit in a stuffy conference room with so many distractions, that you probably end up retaining about 5% of what was taught...

With The Pivot Ready Course you can watch the videos any time you want, ask me questions, and be part of a much larger community of learners.
It's a fantastic way to learn because you are able to pause the instruction and go practice what you've learned. Every task is different, and it is great to be able to practice what you have learned on your own work.
Plus, you get lifetime access to the course. This means you can use it as a resource in the future as you continue to learn pivot tables & Excel.
You can access the course from your work computer, home computer, tablet, smart phone or any device with a web browser.
There's no risk with my 30-day Money-Back Guarantee

My goal is to help you learn pivot tables so you can save time with your job and take your career to the next level. I want you to love this course and use it as a resource for continued learning. If you take the course and are not satisfied with what you learned, you can get a full refund.
There are no hoops to jump through. If you're not smiling, then I want to know about it. 🙂
Get Me Started Already!
Here's what you need to do to get started. Choose a package below and click the Enroll Now button.
- Fill out the secure payment form. You will also create an account for the Excel Campus Members Area.
- The payment will be confirmed within a few seconds and you will get immediate access to the course.
All the modules and videos I discussed are there, and I will be in the comments section answering your questions. Watch the welcome video to get an overview of the course and how to use the software.
Again, I want to thank you for joining me on this journey and I look forward to seeing you on the inside... Please click the button below to get started right away.

Single Student Package
Lifetime Access to the Course
$297 USD
8 Training Modules
5 Awesome Bonuses
Practice Excel Files
Immediate Lifetime Access
30-day Money Back Guarantee
Bonus Mini-course on Power Query
Team Learning Package
Save $94 on 3 Memberships
$797 USD
8 Training Modules
5 Awesome Bonuses
Practice Files & Code Samples
Lifetime Access for 3 Members
30-day Money Back Guarantee
Bonus Mini-course on Power Query
After clicking the Enroll button above you will:
- Complete the secure order form with your credit card information. You can also checkout with PayPal.
- The payment will be processed immediately, and you will get immediate access to the entire course.
Frequently Asked Questions
When does the course start and finish?
How long do I have access to the course?
How long does it take to complete the course?
Can I download the Excel files used in the course?
Can I watch the videos on my iPad or tablet?
What version of Excel do I need?
How do I ask questions and get support?
What payment methods do you accept?
Can my employer pay for my enrollment?
Can I purchase multiple memberships for my employees?
What if I am unhappy with the course?

Join This Awesome Group
Your videos are a great tool. Simple, to the point, yet very useful and cover a lot more than just the basics. Thank you so much for dedicating time and effort for all of us!
I had been intimidated by Pivot Tables until watching your videos. Thank you so much!
Great lessons on Pivot Tables. For years I have been reluctant to learn them because I heard they were complicated and took expert knowledge. You have shown me that anybody can create a pivot table. Well done.
Get Started Learning Pivot Tables Today!
Single Student Package
Lifetime Access to the Course
$297 USD
8 Training Modules
5 Awesome Bonuses
Practice Excel Files
Immediate Lifetime Access
30-day Money Back Guarantee
Bonus Mini-course on Power Query
Team Learning Package
Save $94 on 3 Memberships
$797 USD
8 Training Modules
5 Awesome Bonuses
Practice Files & Code Samples
Lifetime Access for 3 Members
30-day Money Back Guarantee
Bonus Mini-course on Power Query
After clicking the Enroll button above you will:
- Complete the secure order form to pay by credit card. You can also checkout with PayPal.
- The payment will be processed immediately, and you will get immediate access to the entire course.
Note: If you have any trouble creating an account and registering for the course, please try the Google Chrome or Firefox browsers. The course software uses some of the latest web technologies and does not work well with some versions of Internet Explorer. Please contact me with any questions. Thank you! [email protected]
© 2024 by Excel Campus LLC. - Disclaimer | Contact Me