This post and video answers a question on how to resize the plot area of a chart to prevent the axis titles and labels from overlapping. If you can't read the titles or labels this tip will help cleanup your chart to make it more presentable.

Video – How to Resize the Plot Area
Links mentioned in the video:
The Chart Area and Plot Area Are the Same Size
Sometimes the plot area can fill up the entire chart area. This makes it difficult to distinguish the difference between the two areas of the chart.
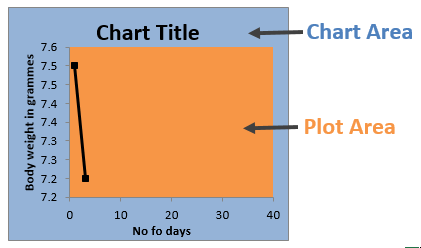
The plot area also resizes with the chart area. So if you select the outside border of the chart and resize it, the plot area will also resize proportionally.
In the case of Tony's chart in the video, he was having trouble seeing the axis titles and labels because the plot area was too large. Therefore, the plot area needs to be smaller than the chart area to fit the axis labels, and titles outside the chart.
Get Your Question Answered
This article is based on a question from Tony.
You can get your Excel or VBA question answered too! Click the link below to submit your question. You will also be able to upload your file or screenshot to help explain your question.
![]()
Please leave a comment below with any questions. And don't forget to subscribe to my free email newsletter below to stay updated with all these answers. Thank you!


[…] your chart titles are overlapping the chart labels, watch Jon Acampora’s video to see how to fix the […]
Thank you!!
This was exactly what I needed to fix my chart
Awesome! Thanks for letting me know Elisa! 🙂
Not in my 2003. I get resize handles for everything BUT the plot area.
Good tip. Thank you. However, it seems not to work with waterfall charts in Excel 2016. The handlers appear in the corners but they cannot be used to resize the plot area?
(My x-axis labels are quite long and I want a bigger space between the bottom of the plot area and the bottom of the chart area)
Thanks Nick! It looks like the waterfall chart is limited right now and you can’t change the size of the plot area. I will look into why this is, and see if there might be a fix. Thanks!
Hi, although this add-in is what I need, it does not seem to work in my excel 2010 German edition. I cannot find also the dialog box, although I have installed everything according to the instructions.
Hi, I have just now found it! Thank you very much for this add-in!
Ok great! Thanks George! 🙂
How can you specify the plot area precisely? Is there something like a resize option where I can tell excel what the plot area should be in numbers? I have ~20 plots where the plot area, title/axis, and chart size need to be exactly the same. Clicking borders and dragging them for each one isn’t just a massive pain but also impossible to keep consistent over that many graphs. Help greatly appreciated!
THANK YOU SO MUCH. I have been struggling with this issue for the past half hour, I swear I had clicked every button on the chart.