Bottom Line: Learn to format and use pie charts properly, and when to use alternative charts instead.
Skill level: Beginner
Video Tutorial
Download the Excel Files
You can follow along with the video using the files below.
Pie or Not?
When it comes to the art and science of data visualization (a.k.a. principles for creating charts and dashboards), pie charts are a controversial topic.
Some experts will tell you to NEVER use pie charts. Others say use them sparingly, and usually have a strict set of rules to follow.

The decision on when to use pie charts in Excel usually comes down to a few factors.
- Would using a pie chart clearly tell a story about the data?
- Are you dealing with data that adds up to 100 percent?
- Is your boss insisting that you add pie charts to your spreadsheet?

Excel has a built-in pie chart maker that can convert a set of data into a visual pie instantly. But just because something exists, that doesn't necessarily mean it should be used.
My feeling is that pie charts should be used about as often as you should eat pie: occasionally. And when you do, I want to make sure you are using the right charts for the right reasons.
Let's look at 7 different pie charts to see how we can make them over to be better at telling the story you want to convey. But first, let's define what a pie chart actually is.
What Are Pie Charts?
Pie charts, also known as pie diagrams or pie graphs, are used to display the percentage of total.
All the slices (segments) must add up to 100%. Any individual slice will display its portion of the whole.
The following pie graph example shows the revenue for each region as a percent of total revenue. The sum of all regions should always equal 100%. This is one advantage that pie charts have over most other charts.
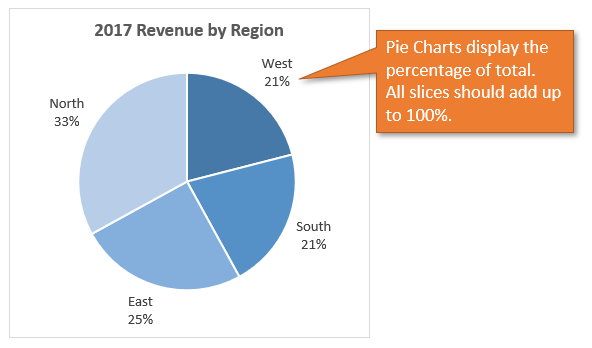
The circular shape of the pie quickly conveys the message to the reader that we are dividing the pie into slices and can’t have more/less than 100%.
Note: The data labels might not add up to 100% exactly if you are rounding to whole numbers.
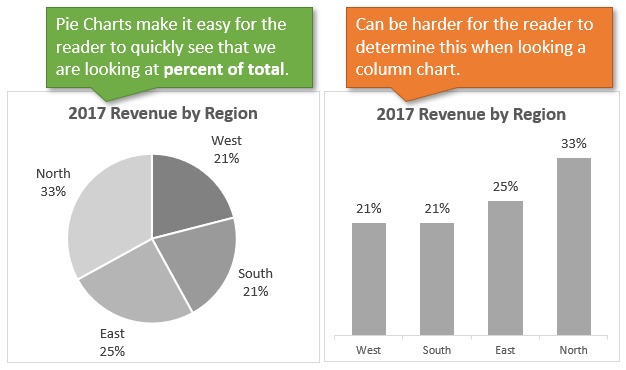
When using a bar/column chart for percentage of total, it is sometimes more challenging to quickly determine that all the bars add up to 100%.
So let's now look at our 7 pie chart makeovers to get a better idea of how pie charts should look and when they should be used.
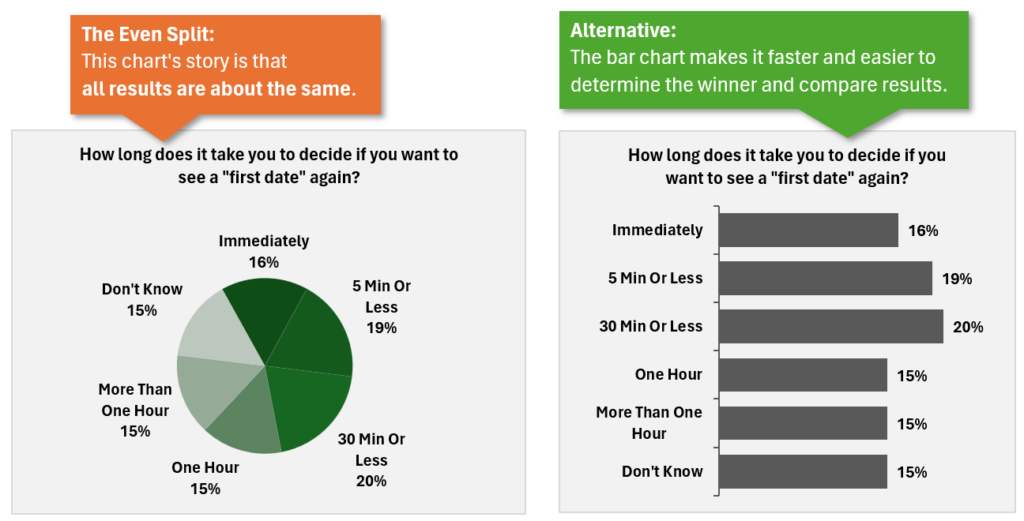
1. Even Split vs. Clear Winner
The first pie chart is one I found in a magazine. Unfortunately, because each pie slice is roughly the same size, it doesn't readily convey a point that is obvious to the reader.
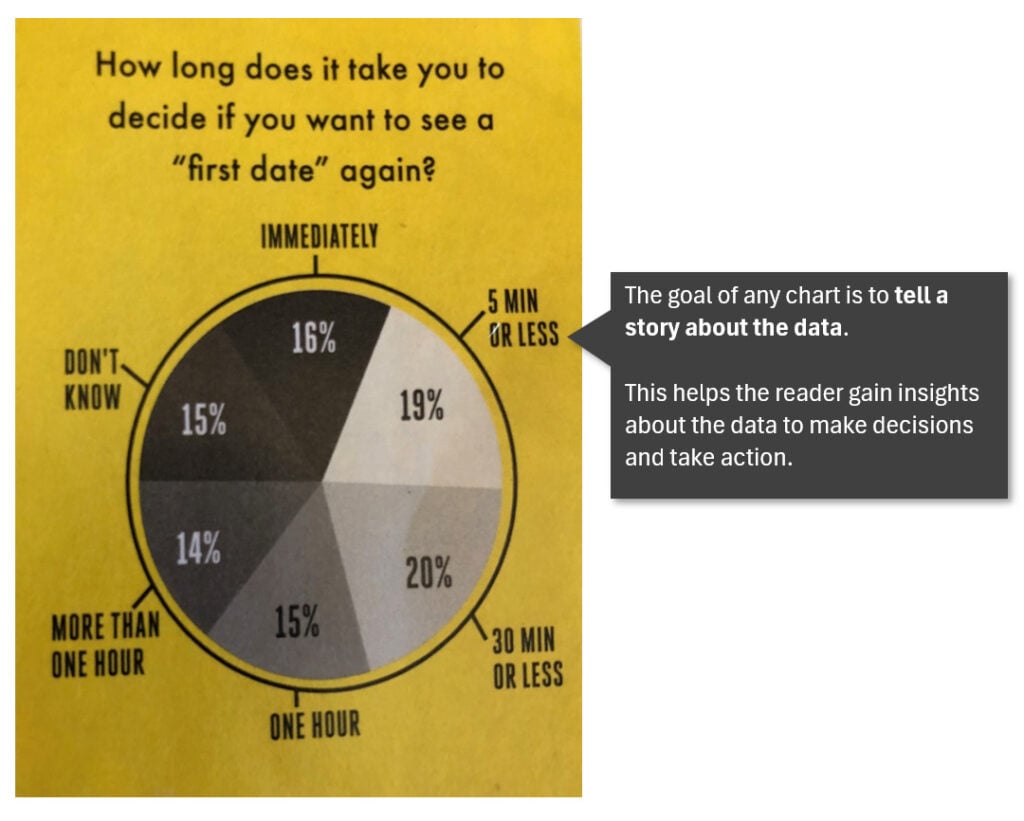
In looking at this pie graph, nothing stands out as an important takeaway. I could just as easily have come away with the same information by looking at the table of data it came from.
Unless the point you are trying to make with your chart is that all components are evenly split, this type of pie chart is not necessarily helpful for telling a story.
If it's your intention to compare the slices more closely, a better option might be to use a bar chart, where the differences are more obvious.
The Makeover
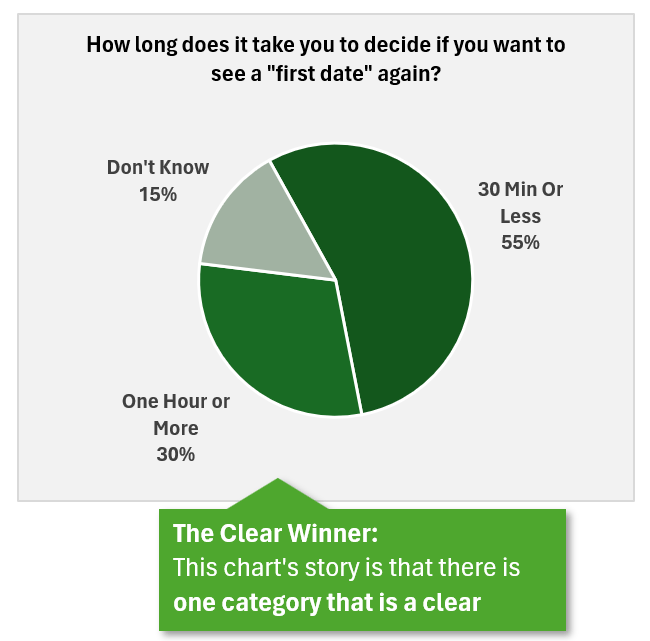
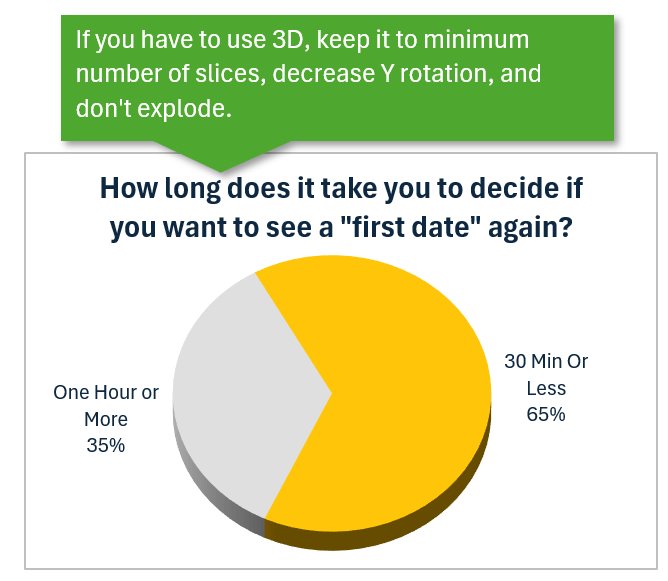
From the existing pie chart, it would appear that it doesn't really matter how far into the first date it takes for a person to decide if they want to go on a second date. It's doubtful that the magazine was trying to convey that point. It would be a better option, then, to change this pie diagram into one that shows a clear winner.
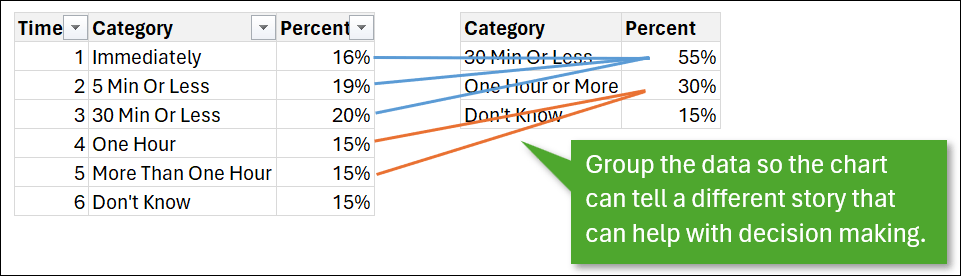
If we were to group the first three categories into one category of “30 Minutes or Less,” the point of the graph becomes more apparent. Namely, you should make your best impression in the first half hour of a date if you want any repeats.
The chart might benefit even more from the exclusion of the “Don't Know” category since that information isn't really helpful.
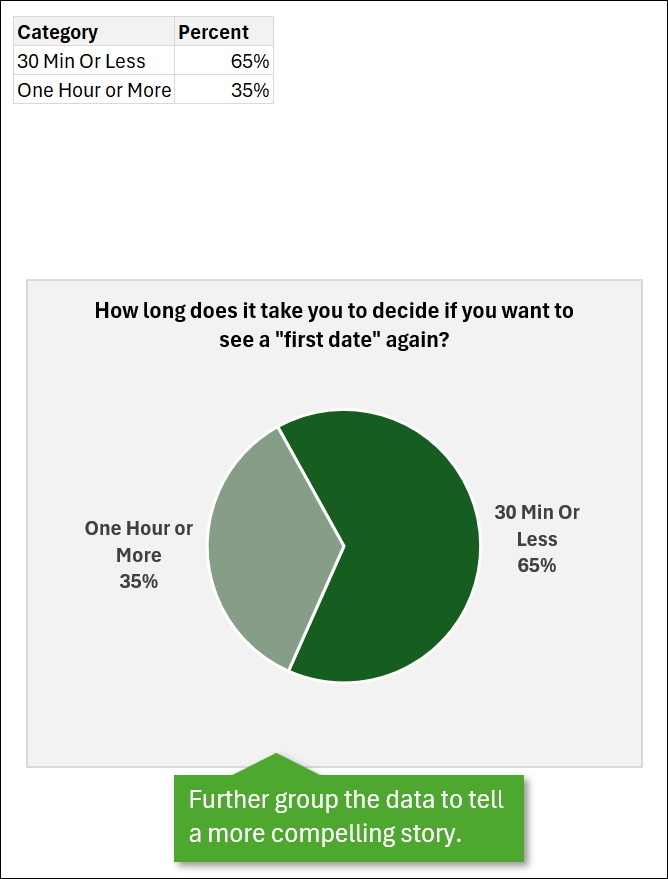
Changes like those can't always be made, but the point is to look at what story a pie chart should be telling, and determine if that story is obvious to your reader.
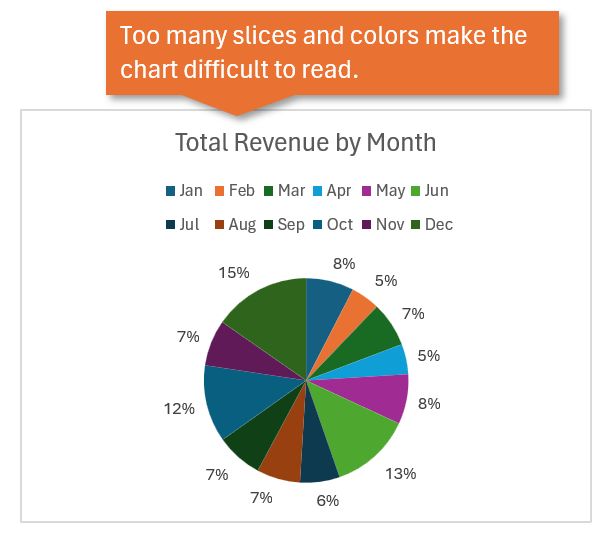
2. Too Many Slices
In this chart, each month is signified by a piece of the pie, and because the slices are so similar in size, it makes comparison really difficult. With so many colors, it's not easy for the eye to quickly determine which month is which. (Just look how similar the colors are for January and October, or March and December. Confusing!)
The Makeover
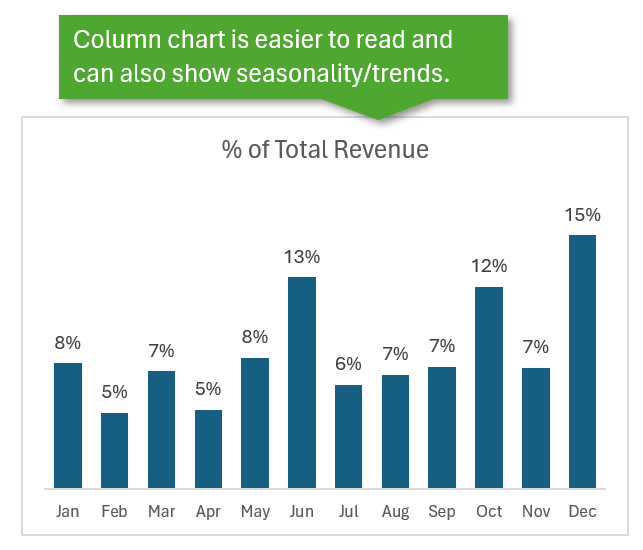
A better alternative might be to use a column chart, where the differences in size are much more discernable to the eye. And because this chart deals with monthly figures, the column chart could even bring to light some trending over time.
Clear Winner: An Exception to the Rule
While having too many slices can be a problem for most pie charts, it doesn't necessarily preclude you from using one, especially if one or two of your slices stand out as different from the rest. This goes back to the idea of the clear winner. In the pie chart below, the chart does a great job of emphasizing just how massive the importance of December is in terms of annual revenue.
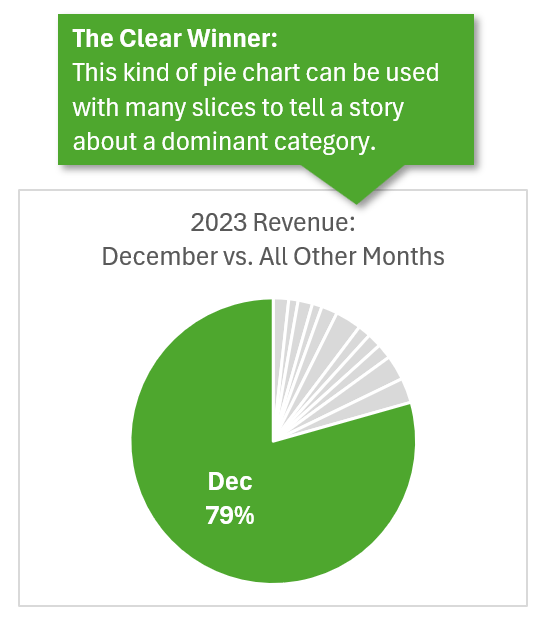
I think choosing the grey color for January through November further helps in the visual storytelling because your eye easily translates them as “all the other months” without trying to discern which is which.
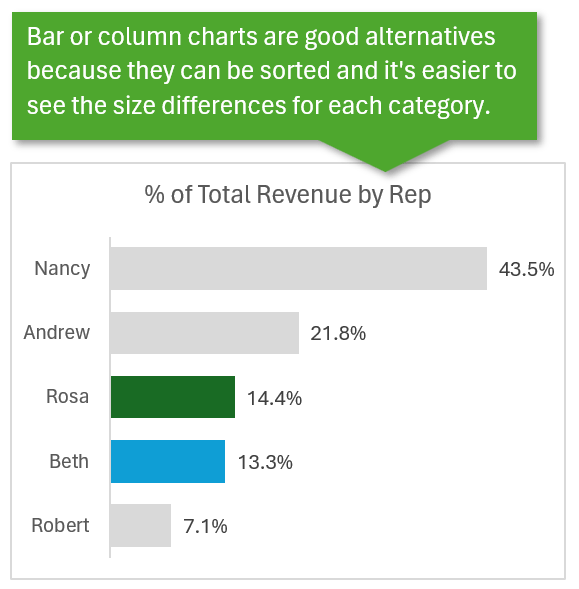
3. When Rank Matters
When rank is an important part of the story, a pie chart can sometimes fail to show that difference. In the following chart, it's difficult to discern if Beth or Rosa takes third place in sales revenue because the slices are so similar in size.

The Makeover
Here, the makeover is to actually scrap the pie chart for a bar or column chart. These can better tell the story when it comes to ranking the categories. Below, we can easily tell that Rosa takes the bronze medal in this competition.
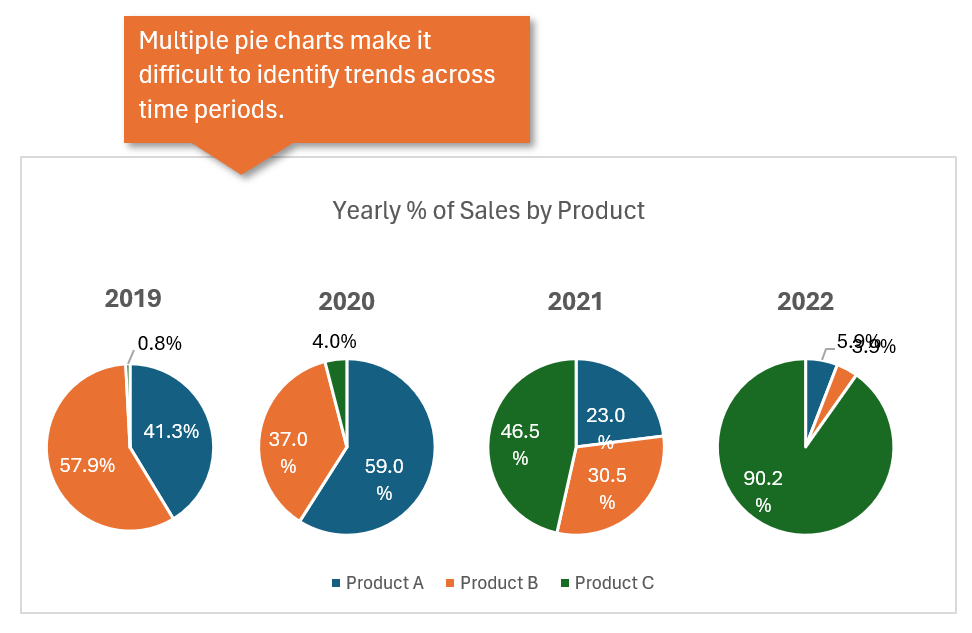
4. Panel Charts
Here's a panel chart where pies are used in an attempt to show trends over time. Unfortunately, it doesn't do it well.
The Makeover
Again for this one, I think the best option is to move away from pie charts completely and use something like a line graph instead. Below, the trends we are looking to convey can be quickly and intuitively deciphered.
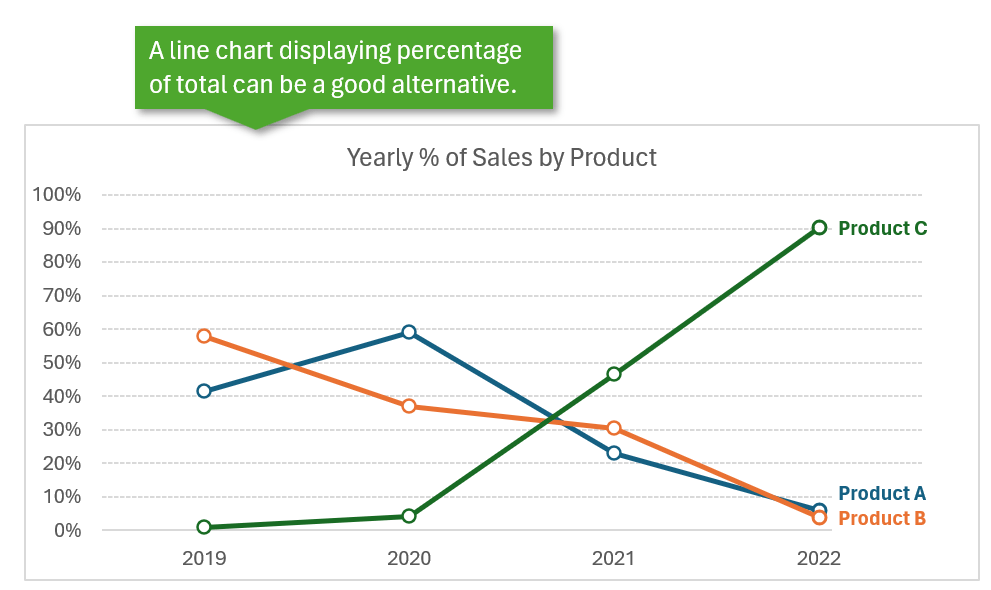
Again, I want to note that one advantage pie charts have over line charts or bar charts is that they immediately tell the reader that we are looking at percentage of total. The lines or bars don't readily convey that everything adds up to 100%. One workaround for this is to include that information in your chart title.
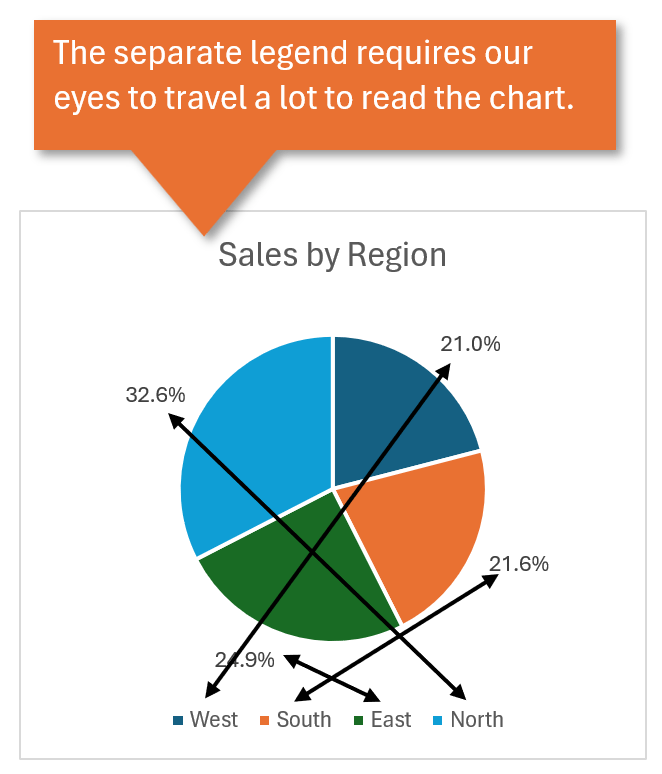
5. Avoid the Legend
In this chart, the use of a legend requires that the eye travel back and forth between the pie piece and its corresponding label. When colors are similar or there are a lot of them, that can cause confusion or just be a hassle.
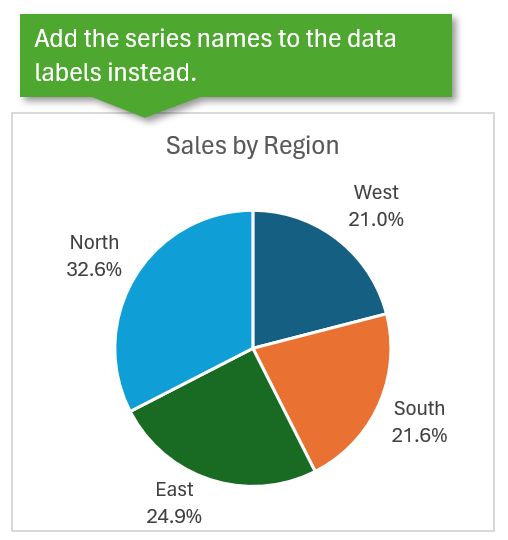
The Makeover
The easy fix is to add the names to the data labels so the information you need is not split between two areas of the chart.
If you're not sure how to move those names, I quickly walk through the steps in the video tutorial above.
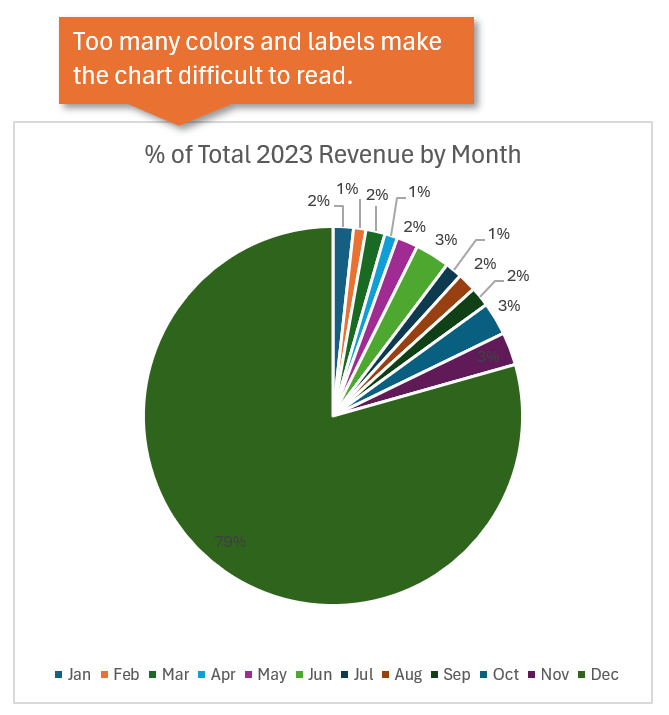
6. Too Many Colors & Labels
In our next pie diagram, we see a lot of what data visualization experts call “chart junk.” There are too many colors and too many labels vying for your attention that don't necessarily add to the story we're trying to tell.
The Makeover
As we saw earlier, greying out the smaller slices and removing their labels doesn't detract from the chart. Rather, it enhances the main point of our story: that the vast majority of revenue is received in the month of December.
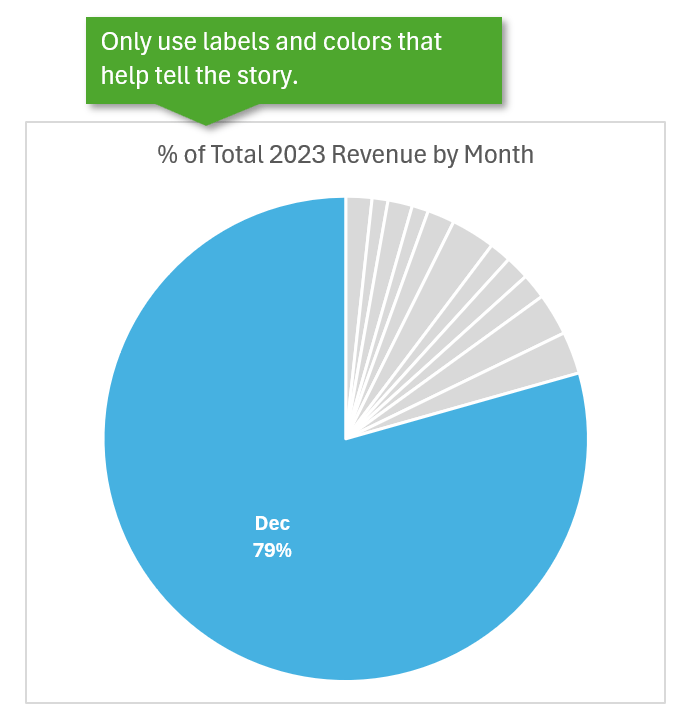
The processes for removing those percentages, changing the colors, and moving the label inside the pie are all explained in the video tutorial if you need help with those steps.
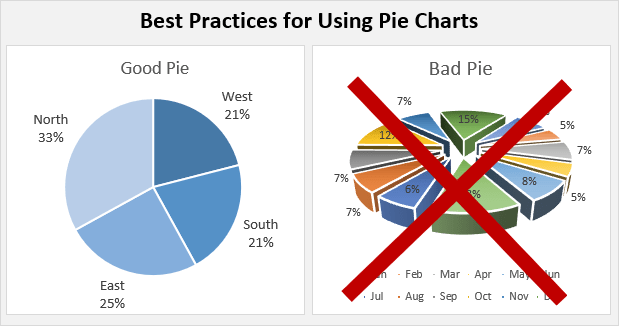
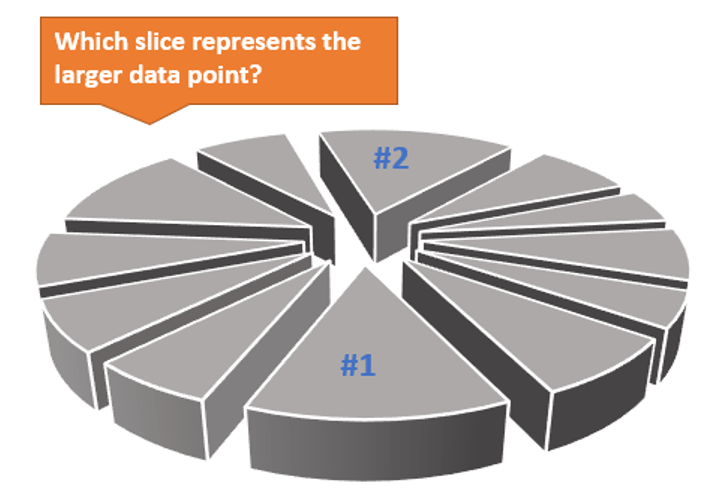
7. 3D Confusion
Exploding 3D pie charts are an absolute no, in my opinion. Here's why.
In the chart below, it's really difficult to determine which slice of pie is bigger. Our eyes tell our brains that #1 is the bigger slice.
In reality, #2 represents a larger portion of the total, but because of the angle of the chart, our perception is altered.
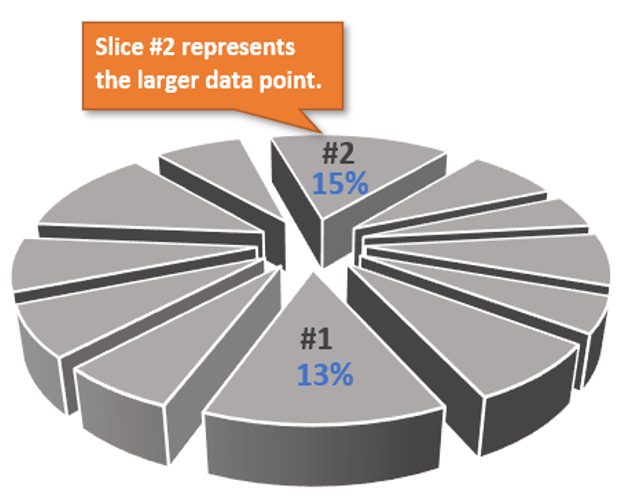
For that reason, my advice is to avoid 3D pie charts altogether. If your boss insists and you have to use one, make sure you use the smallest number of slices possible and reduce the rotation so that you are looking at it from above rather than the side.
Pop Quiz!
Based on what you've learned from this post, which of the following Excel templates for pie charts is best?
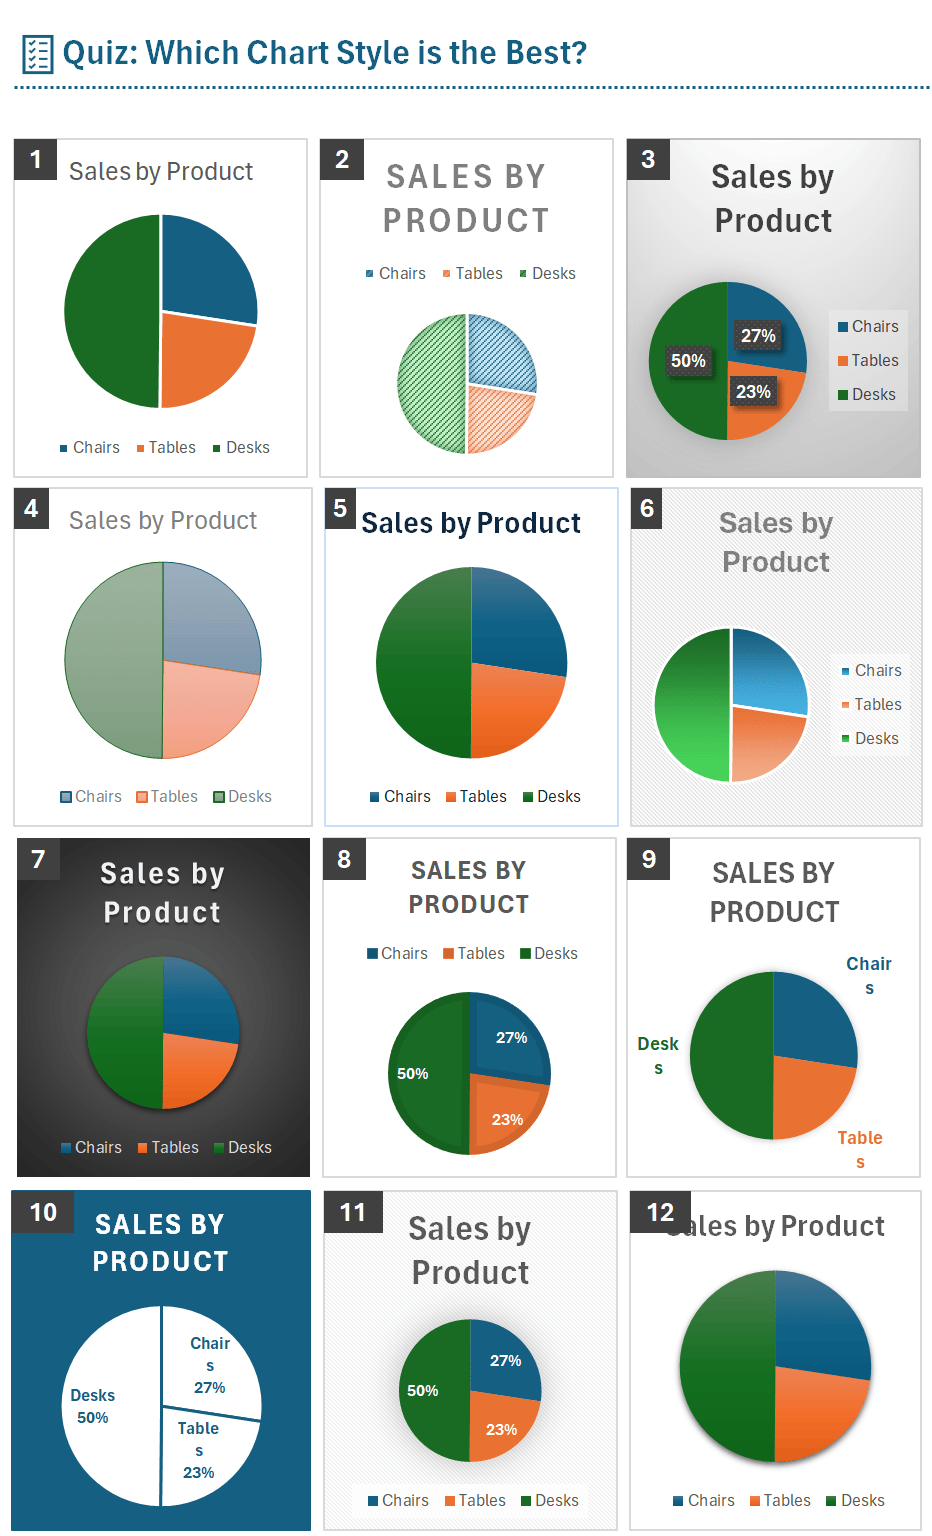
My answer is Number 10!
Why? Because it has both the category name and the value together, making it easier to read. It might require some color formatting, but right out of the box, it provides the best option.
Conclusion – Use Pie Charts Like Pie
Hopefully, this post is helpful for you. Remember that when we are telling the story of data with charts, we want it to be an honest one that is easy to consume.
The main rules and best practices for pie charts are:
- Keep the number of slices to a minimum.
- Use a bar/column chart when the data points are close in value. It is hard for our brains to judge the size differences between triangular shapes.
- Don't use 3D pie charts, ever.
- Don't use multiple pie charts to make comparisons.
- Remove the legend and put the data labels on or outside the chart slices.
- Do your best to educate your boss and audience, but don't get too upset when they insist on having pie charts.
- Use pie charts sparingly.
Telling the story with a pie chart in Excel can be challenging. So, I recommend that you use pie diagrams sparingly—about as often as you should eat pie in real life. We all know we shouldn’t eat pie every day, and the same is true for creating healthy dashboards.
For your convenience, I've created this one-page reference guide that contains the tips I've shared with you today. Enjoy!
Reference Guide
Additional Resources
Here are some additional resources on pie charts and data visualization. This will help you learn the right chart types to use for your data, and design principles that make them easier to read and understand.
- Stephen Few (Perceptual Edge) – Article on Pie Charts | Website | Books on Amazon
- Edward Tufte – Website | Books on Amazon
- David McCandless (Information is Beautiful) – Website | Books on Amazon
- Cole Nussbaumer Knaflic (Storytelling with Data) – Website | Books on Amazon
- Article and Video on How to Create Progress Donut Charts with Conditional Formatting
- Power BI Dashboards & Data Course by Excel Campus (that's me)
So what are your feelings about pie charts…or pie for that matter? Leave a comment below with any questions or suggestions on the subject.
You’re now equipped with some pretty good pie skills for the holidays! 🥧🍕🍰


Great article, Jon, with a few simple guidelines to remember. Thanks for also showing alternatives to pie charts in certain situations.
Thank you Louise! 🙂
Great article. It all seems so logical and yet I have at times used pies when it was totally inappropriate to do so. I get the point now, use pies sparingly!
Thanks Tony! And don’t feel bad. We have all used the wrong charts at the times. Figuring out which chart to use can be the toughest part of creating charts. Sometimes it takes several iterations to get it right. 🙂
Great article. You sliced up the topic very well. I appreciate this post and your site as a wonderful resource that many can rely on. Thank you for making my job easier. Have a great day!!
Thanks so much, John! I really appreciate your support. Hope you have a good one too! 🙂
You should include a couple research papers by Robert Kosara and Drew Skau, summarized in ‘A Pair of Pie Chart Papers’ at https://eagereyes.org/papers/a-pair-of-pie-chart-papers
It turns out that when used appropriately (2D, not too many points, etc.), pie charts are not so evil, and not so hard to interpret.
Thanks for sharing, Jon! I had not seen that article before, but it is very interesting.
Perfect timing. I complete a yearly report and each year my boss wants pie charts. The boss will not be getting pie charts this year.
I do have a question. There are 254 counties in Texas. I have to show data for all 254 counties. Comparing data. What do you suggest to show the data?
Thanks Denise! Great question! I think a lot will still depend on what type of data it is and what you are trying to compare with the data.
Are you trying to show a percentage of total for each county? Or, are you comparing values for each county?
Does there need to be a data point and label for each county on the report? Or can you just show a top # and bottom # of performers?
This might make for an interesting challenge, so let us know if you can provide a little more detail. Thanks again!
Maybe regionalize the counties and use macros or slicers?
Thank you for this wonderful article
Additional Information :
Negative values cannot be displayed in Pie especially when compared to positive values
Regards,
Thanks Mhmod! Great point. This is also true of zero values, and forgot to mention that in the article. I will update it.
Thanks again and have a nice day! 🙂
Great little article, thank you!
Plus the plethora of pizza and pie puns positively primed me to practice populating my presentations!
Haha! Thanks Laurel. I love it! 🙂
Hi Jon,
I enjoyed reading the article. It updated my awareness on Pie Charts.
Mostly I use them to compare percentage of total, and here it comes, when I have quite some slices (say 6 to 10) I always use a Pie-of-pie or Bar-of-Pie chart, where I put the smaller slices in the 2nd chart. I never use a Pie chart when I have more than 10 slices.
Thanks for sharing jon.
Hi John,
As always, very informative, excellent way in presenting and “slicing” the topic.
Thanks for the resources as well.
Hi Jon
Thank you for this informative newsletter. Now, I can think differently when to use which chart.
Regards
Maki S. Hussain
Baghdad – Iraq
Very helpful! As someone who is generally critical of pie charts, this nicely puts pies in perspective. Thanks, Jon.
Was that pie chart or pizza chart? Delicious, all the same.
Another problem with pie charts is that they don’t allow you to plot error bars (such as 95% confidence intervals) when displaying the results of statistical sampling. Sampling results are often displayed as percentages that add to 100%, which would presumably make a pie chart an option.
Let’s say we’ve taken a poll to determine which of 3 candidates is most likely to win the next election. We’d then end up with 4 estimated percentages that add up to 100% (one each for the three candidates and one for undecided). Four slices would not be too many for a pie, but we need a way to display the uncertainty in our estimates. Although we could label each slice with both the estimate and the confidence interval (e.g., “40% +/- 5%”) this does not allow the reader to quickly compare the estimates and confidence intervals. The obvious solution is to use a bar (or point) graph with error bars corresponding to confidence intervals. Then the reader can quickly see whether error bars for particular candidates overlap, giving the reader a much better perspective on how close the election might be.
Very good article, thaks Jon, Great hints and tips.
Mark
In an interactive dashboard, a pie chart can be the source or target of an action. When used as the source of an action, the chart can be configured for single or multiple selection mode. This determines the number of data points that can be selected at a time. When a chart is the source of an action, it can, for example, trigger a map to pan or zoom, or filter another dashboard element (see Charts as the source of actions ). Conversely, when a chart is the target of an action such as a map extent change, the chart can be filtered so the data it displays corresponds with the map’s new extent.
Great story telling Jon! Game me a better insight of Pie charts, and ways to use them (sparingly).
Fantastic presentation, thank you!
What about using two doughnut charts inside each other to show different years?
My fave pie chart is the Pyramid Pie Chart. I have one on my desk at work (and as one of my screensavers) and one in my home office.
Thanks Jon. As a rule I don’t like Pie Charts
But you made me understand that it depends of my low knowledge of this feature.
Great insights on using pie charts! I appreciate the tips on when to opt for them in dashboards. They can really enhance data visualization, but knowing the right context makes all the difference. Thanks for sharing these best practices!
Great insights on using pie charts effectively! I appreciate the emphasis on limiting the number of slices to enhance clarity. It’s so easy to overwhelm the viewer with too much information. The tips on color contrast and labeling are also super helpful. Thanks for sharing!
Thanks for doing this, it helps a lot of people like me, I always love to learn Excel, but I don’t find myself inthusiastic enough to learn it properly, however your method seems a bit more detail and better that make me to stay focus for awhile.