Bottom line: Learn how to analyze multiple choice survey data. We will use Power Query to transform the data, then analyze the results with Pivot Tables and Charts. A 3-part video series explains all the techniques in detail.
Skill level: Intermediate
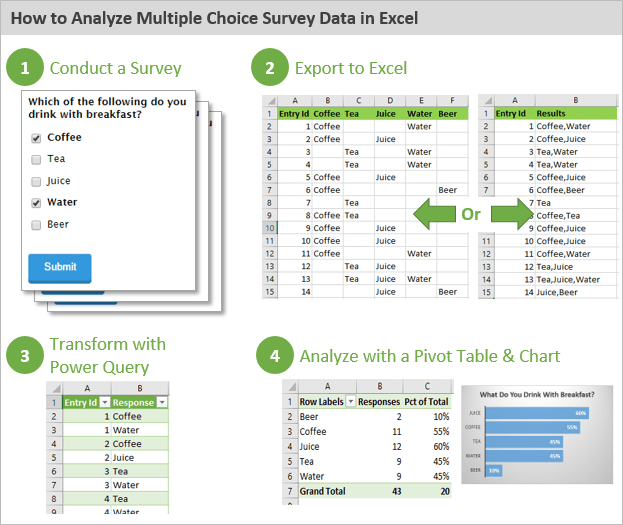
Survey Data is Not Always Easy to Work With
In this article we are going to learn how to analyze data from a multiple choice survey or test.
It's not always an easy to work with survey data in Excel. Survey software programs export the data in different layouts that are not the best format for use with a pivot table or formulas.
This is especially true with multiple choice survey questions, where the person taking the survey can choose multiple items. The same problems can occur with a multiple choice test or quiz.
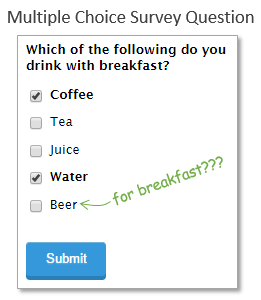
Here is an example of the survey question we will be working with. As you can see, the person taking the survey can click multiple checkboxes for their favorite breakfast drinks.
Download the File
Download the file to follow along.
Transforming the Data with Power Query
The first thing we typically need to do is transform the data into a layout that is suitable for use with a pivot table.
If you are not familiar with Power Query or pivot tables, I provide links to more resources below.
The exported data is typically in one of two formats:
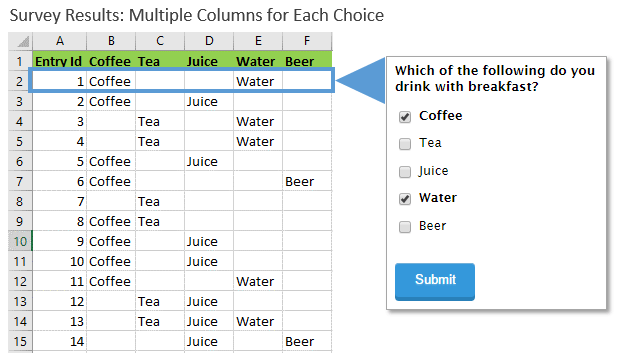
Format #1: Multiple Columns for Each Choice
The most common is where each choice for the survey question is listed in a separate column. Each row of the data set contains one person's results, and the corresponding columns contain their answers to the question.
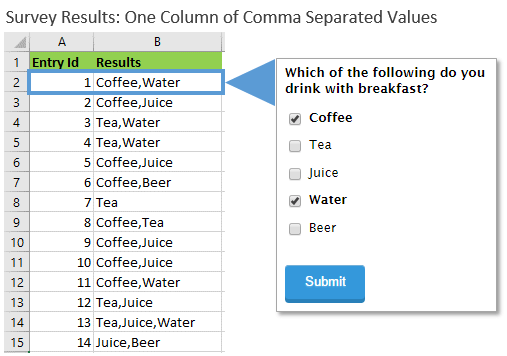
Format #2: One Column of Comma Separated Values
Another common layout is where there is one column of results that contains comma separated values.
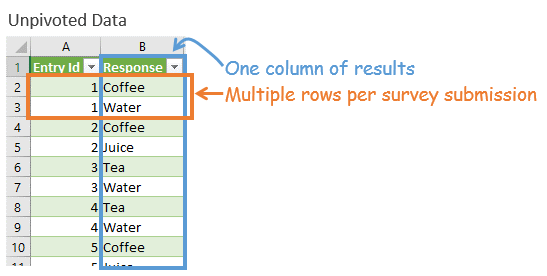
Unpivot the Data with Power Query
The first thing we need to do is get this data in a format that is easier to summarize with a pivot table.
We want the data to look like the following, with one column that lists the results. We will then have multiple rows for each survey taken. This format will make it easy to create a pivot table to summarize the results.
Power Query is an awesome (free) tool that makes this transformation easy!
Power Query is available for the 2010, 2013, 2016 Windows versions of Excel. Here is an article on an overview of Power Query, and guide on how to install it.
The following videos walk through how to do the unpivot transformation using Power Query for each of the raw data formats above.
Video #1: Unpivot the Data with Multiple Columns
Double click video to watch full screen HD.
If you are new to Power Query checkout my articles on an overview of Power Query and complete guide to installing it.
Video #2: Unpivot the Data with Comma Separated Values
Double click video to watch full screen HD.
My friends Ken Puls and Miguel Escobar just released their new book on Power Query, M Is for (Data) Monkey. (Amazon link)


I just got the book and am still reading it, but I think it will be a fantastic resource to help you learn Power Query.
Analyzing the Data with Pivot Tables & Charts
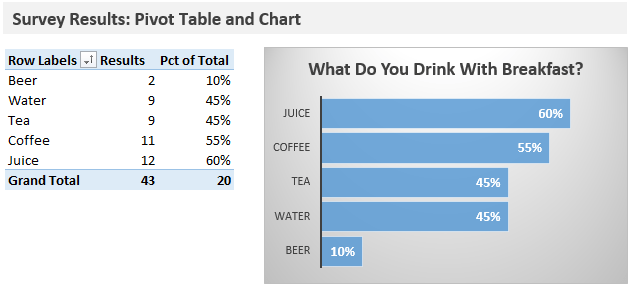
Once the data is in the proper format, we can then use a pivot table to quickly summarize the results.
The following video explains how to create a pivot table to show how many responses were made for each choice. I use a formula to calculate the percentage of total, and then insert a chart to display the results visually.
Video #3: Summarize & Analyze Survey Data with Pivot Tables and Charts
Double click video to watch full screen HD.
If you are new to pivot tables then checkout my video series on an introduction to pivot tables & dashboards.
Different Ways to Analyze Survey Results
There are a lot of different ways to analyze survey results in Excel. For this article I wanted to show different tools that you can use including Power Query and Pivot Tables.
Most of the time we will need to transform the data for use with Pivot Tables or formulas. Power Query is a great tool that makes this task easy.
Of course, the tools you use will depend on the answers you are trying to find with your survey results. What other questions do you have about this data? What metrics would you like to learn how to calculate? Please leave a comment below with your questions or suggestions.


What about surveys with comments – I would like to graph the number of times certain words are used in the comments – I would like to use bubble graphs too!
I think that it depends on a survey. Sometimes Excel is useless.
Thank you for the intro to powerquey. I have data to analyse in the format shown in video 3 so you have saved me a lot of work.
Awesome! Thanks Olwyn!
thanks a lot very helpful
It is very useful for explanation step by step. Thanks a lot.
Thanks Hla!
Many thanks Jon using all your tips at work & learning how easy sorting & analysing data can be Pivot tables are brill for forecasting to
Thanks again Steve O
Awesome! Happy to hear you are learning pivot tables and learning a lot. Thanks Steve! 🙂
it is possible to create a dashboard with 2 raw data? thanks for all tips…
Dear Jon,
Good that you tried to tackle the topic. It think your approach works only in exceptional cases. Take for a example a survey with many questions, some multiple choice some not. You easily end up with a file with about a 100 columns. If you would duplicate respondents what to do with the answers of to not multiple choice answer, do you put blanks there? Not recomemnded for pivots. Double te values, your averages etc will be wrong.
Best regards
Jozef
Hi Jozef,
Great question! Survey data can be difficult to analyze, and there are a lot of different layouts and formats for the results data.
If the multiple choice question was not answered you could add a column with a formula that tested for that. In example #1 we could use the COUNTBLANK function in column G.
=IF(COUNTBLANK(B2:F2)=5,”No Answer”,””)
This would return the phrase “No Answer” in column G if an answer was not made. We could then include this new column in the unpivoted data, and analyze it with a pivot table.
I hope that helps.
Hi Jon,
Your resources have been tremendously helpful. Much thanks! I have questions very related to Jozef’s above.
Scenario: I have survey response data that has many multiple choice questions and number entry questions (think ‘Which brands of work boots do you currently own (check all that apply)’, and ‘How much did your last pair of boots cost’). I am building a dashboard in Excel 2013 with slicers that will allow users to look at the data with different filters on it, so everything will need to be a PivotChart.
Question: If I unpivot several multiple choice questions, I get 30 answers per response ID. What do I need to do next to keep COUNTS/SUMS of prices that respondents entered for the cost question accurate for 1 entry per response ID?
Attempt at a simpler question: How do I create a Pivot Table that shows accurate COUNTS/SUMS of a huge data set that has multiple rows of data per response ID?
Feel free to use Example #1 in your response, but consider there being an additional multiple choice question for ‘Which of the following did you eat for breakfast’ and a single-select response for ‘How many minutes does it take you to eat your breakfast, 10 min, 20 min, or 30 min+”. I’d want to know how to create a pivot table that accurately shows the COUNTS of people that said it took them 10 min, 20 min, and 30 min+.
Much thanks,
Kiki
Hi Kiki,
Great question. Excel 2016 for Windows does have a Count Distinct function that allows you to count unique values in a pivot table. Here is a great article by my friend Debra at Contextures that explains some different ways to go about it. I hope that helps. Thanks!
This is the solution I need! Unfortunately I am working on a Mac and don’t have Power Query. Is the only way around this to do it manually? Thanks!
Hi Katie,
Unfortunately, the options are little more limited on the Mac version of Excel. You can use formulas to unpivot the data. I have another article that explains how to structure your source data for pivot tables. That article has the formula based solution and a sample file you can download.
If your data is in one column separated by commas, then you can use the Text-to-Columns feature to first separate the results into multiple columns. I hope that helps.
Hi Jon,
I have a number of people filling in data in an excel spreadsheet. The spreadsheet is laid out so that the questions are column headings and the users enter the answers below the questions. For each question, the answer is yes or no or na. There are 38 questions. I’m struggling to get the data to “behave” in a pivot table. Any tips?
Ci
Hi Ci,
I think you would want to unpivot this so the first column contains the questions. Then have a column for each answer. One column for Yes, one column for No, and one column for NA. The values in those columns can be the number 1 or the text value of the answer. Here is a screenshot of the data and pivot table.
Let me know if that helps. Thanks!
Jon,thanks for the article. Do you think it could be easier with following way:
1. To List of unique products.
2. To Count nr for each (COUNTIF formula)
3. To Calculate the % foer each product.
Coffee 11 55%
Tea 9 45%
Juice 12 60%
Water 9 45%
Beer 2 10%
Thanks for the suggestion Javier. Yes, you can use a COUNTIF formula instead of the pivot table. The pivot table can save time because it will list the unique values for us and also do the count operation. But either way will work. Thanks again!
ISSUE: PIVOT TABLE does not provide a placeholder for Survey Response that received no responses.
DETAILS: My survey data comes to me with the survey questions as column headers, rows for each respondent, and the actual survey response in the intersecting cell. So, in Power Query, I Unpivot Columns with the Questions (and their Values), and end up with two columns — which I label Q# and Value.
When I go to Pivot Table, if no one selected one of the responses — for example, Tea — in the sample above, then Tea does not appear in the Pivot Tale at all, even indicating 0 as the number of responses.
RELATED ISSUE: If there are any “nulls” in the Values, I would like to be able to show them in my Pivot Table as “Not Applicable.” But I cannot figure out a way to do that, either.
Thanks for any assistance.
Debbi
I am having the same issue. I have a Likert scale survey with numerical values coded from 1 to 5. No one selected the disagree (2) or neutral (3) options, but I need to show that in my pivot table.
David
How can we transform the data(answers) from survey to an Excel chart without cutting and pasting.
Thanks,
Jose
Can one use pivot tables to compare data from one year to another eg 2012 vs 2018. maybe in 2010 the answer was NO and in 2018 its YES.
so i can analyse how many things changed from a no to a yes and the percentage change
Hi Tendai,
Yes, this can be done with pivot tables. You can put the year field in the rows or columns area, then apply a filter for multiple items (years).
I hope that helps.
Thank i did receive the respond and i did send you an email.
Great at showing how to get multiple selection survey data into easy to see values and percent. But how do you get it to merge back with the original data? For example, using your data…I want to see the rest of the answers to the survey for those that chose Juice as one of their drinks of choice.
Great videos! However I notice that PowerQuery is only available on Windows. Any suggestions on how to achieve a similar result on Mac? Thank you.
Very informative and easy to follow videos! However I have a question that I hope you will have the answer for.
I have data collected from a survey that includes several multiple choice questions (around 12 different columns that include multiple answers to be split). Now when I want to analyze the data, I want to create a pivot table that includes all the columns that I have in the survey. Is there a way to do it? or is there a way to connect all the different sheets that I have for the cleaned data? P.S. I tried to do a power query for the whole survey table to clean it once but excel crashed.
I highly appreciate your help on this.
This is a great tutorial! I’ve been wanting to learn how to analyze survey data in Excel for a while now. This tutorial was very helpful.